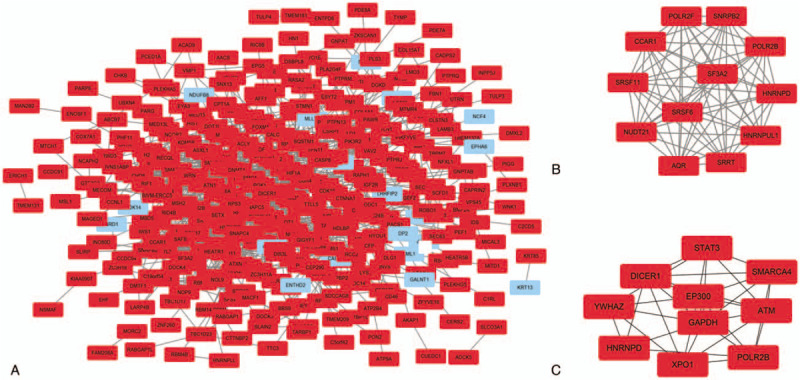
Figure 4.

PPI network of the differentially expressed genes (DEGs) (A). A significant module of the DEGs (B). Top 10 hub nodes of DEGs (C). Red colored nodes represent up-regulated genes, blue colored nodes represent down-regulated genes. PPI = protein–protein interactions.
