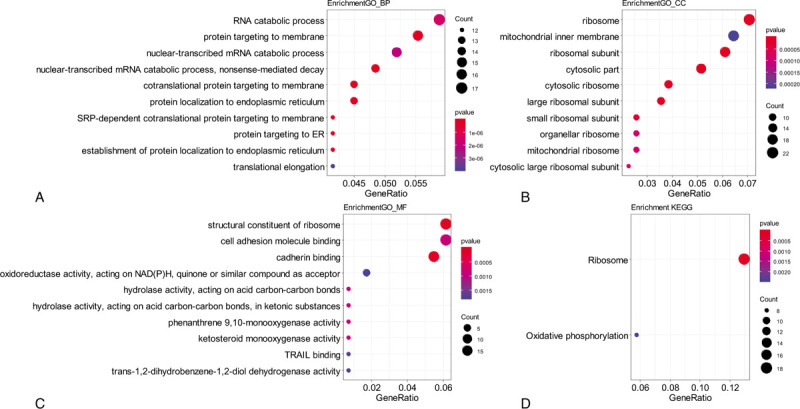
Figure 3.

Functional analysis of module blue. Legends: A–C, Gene ontology enrichment analysis for biological process (BP). A, cellular component (CC) B, and molecular function (MF) C, of genes in module blue; D, KEGG pathway enrichment analysis of genes in module blue; The size of the bubble indicated the counts of genes, and the color indicated the P-value. KEGG = Kyoto Encyclopedia of Genes and Genomes.
