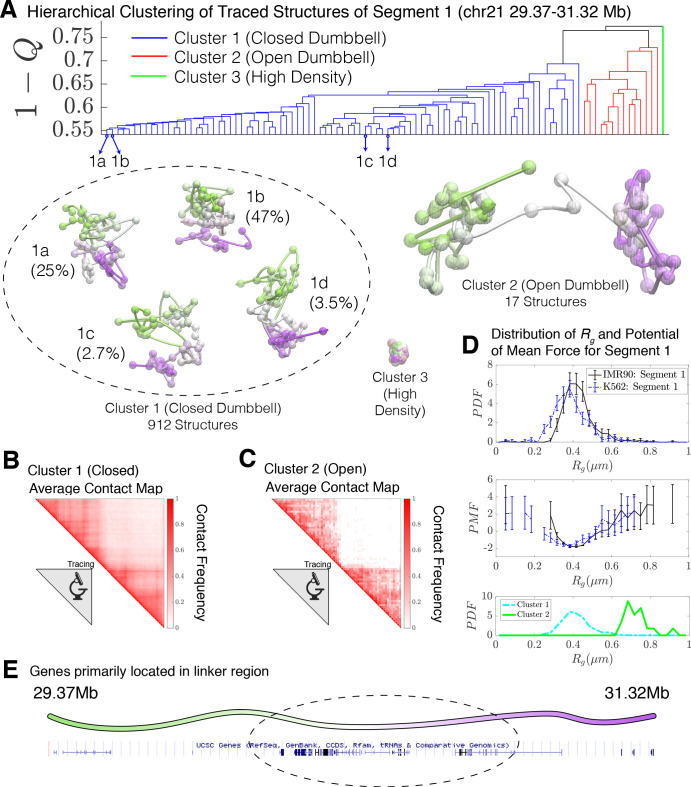
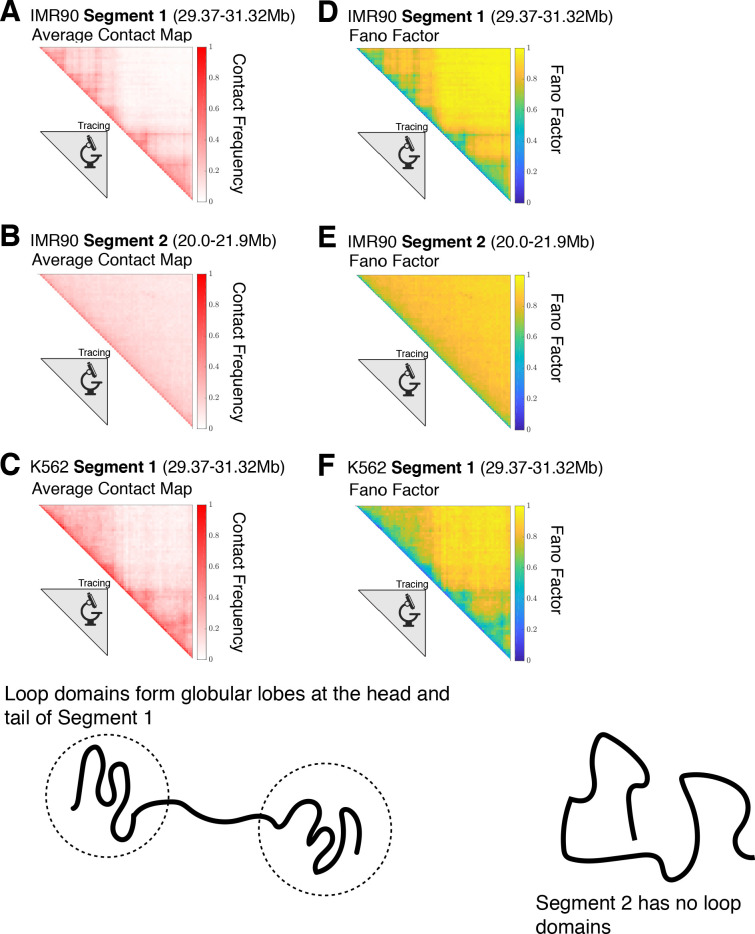
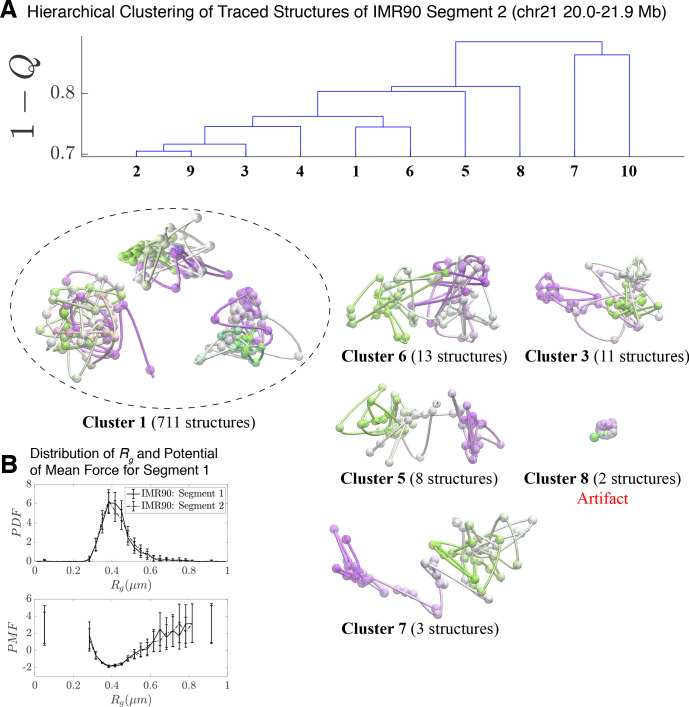
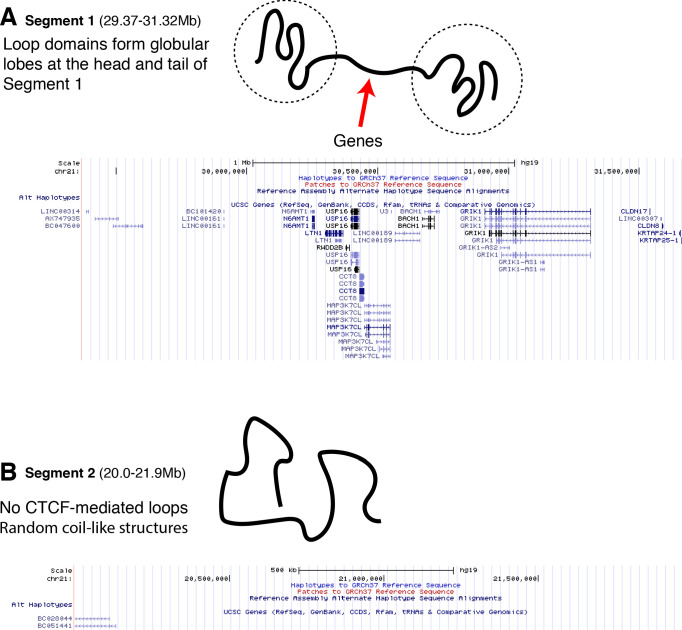
Figure 2. Hierarchical clustering and the detailed structural analysis of traced Segment 1.
(A) The dendrogram representation of the hierarchical clustering of Segment 1 (chr21 29.37–31.32 Mb for IMR90 and K562 of Bintu et al., 2018), where is used as the distance between two structures. The clustering reveals three main clusters: closed dumbbell, open dumbbell, and highly dense structures. Further analysis of Cluster 1 reveals the presence of sub-clusters labeled 1a–1d that represent the gradual opening of the closed dumbbell. Representative traced structures are shown for each of the clusters and sub-clusters. The population-averaged contact maps for the closed and open structure clusters are shown respectively in (B) and (C), where 330 nm is used to define a contact between two 30 kb loci. (D) The distribution of the radius of gyration (top), the corresponding potential of mean force (center), and the distributions of radius of gyration for Cluster 1 and Cluster 2 (bottom) are shown for the traced structures of Segment 1 of IMR90 and K562. The distribution exhibits a heavy tail to the right of the average value, indicating the existence of open, elongated structures. (E) The UCSC Genes track is plotted along the genomic positions of Segment 1 using the Genome Browser (Kent et al., 2002). Figure 2—figure supplement 1 shows the contact maps for the experimentally traced segments of chromatin. Figure 2—figure supplement 2 shows the distributions of the radius of gyration for the sub-clusters of closed dumbbell structures obtained experimentally using tracing. Figure 2—figure supplement 3 shows the hierarchical clustering and detailed structural analysis of the experimentally traced Segment 2.


