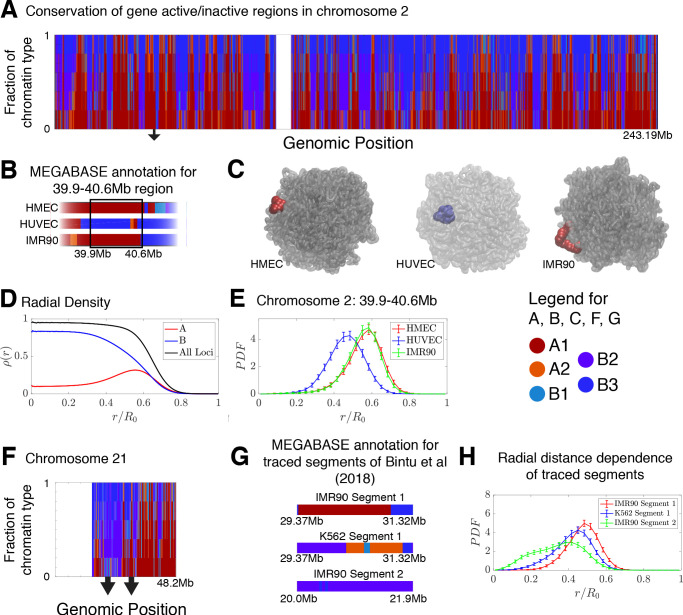
Figure 4. Conservation of compartmentalization across cell types and the radial dependence of marked chromatin.
(A) A stacked bar chart is used to represent the distribution of chromatin type annotations predicted by MEGABASE as a function of the genomic position along chromosome 2 (hg19). The colors correspond the chromatin types given in the Figure Legend. For a given genomic position, the relative height of a particular color indicates the fraction of that particular chromatin type predicted at that locus. (B) The MEGABASE prediction of the chromatin type is shown for the chromatin segment 39.9–40.6 Mb of chromosome 2 for HMEC, HUVEC, and IMR90. A black arrow in (A) highlights the location of this segment. (C) The chromatin segment 39.9–40.6 Mb of chromosome 2 is shown in a representative structure for each of the cell types, where the color of the segment denotes its MEGABASE annotation. For HMEC and IMR90, the segment of chromatin tends toward the chromosome surface, whereas the segment tends toward the interior for HUVEC. (D) The radial density as a function of the normalized radial distance is plotted for A compartment loci, B compartment loci, and all loci for simulations of chromosomes for the HMEC cell type. (E) The probability density functions of the radial distance are shown for the center of mass of the segment 39.9–40.6 Mb of chromosome 2 for HMEC, HUVEC, and IMR90, respectively. (F) A stacked bar chart is used to represent the distribution of chromatin type annotations predicted by MEGABASE as a function of the genomic position along chromosome 21 (hg19). The arrows indicate the locations of the traced segments of Bintu et al., 2018: Segment 1 (29.37–31.32 Mb) and Segment 2 (20.0–21.9 Mb). (G) The MEGABASE annotation of the traced chromatin segments are given for IMR90 and K562. (H) The distribution of radial distances of the center of mass of each traced segment is shown.

