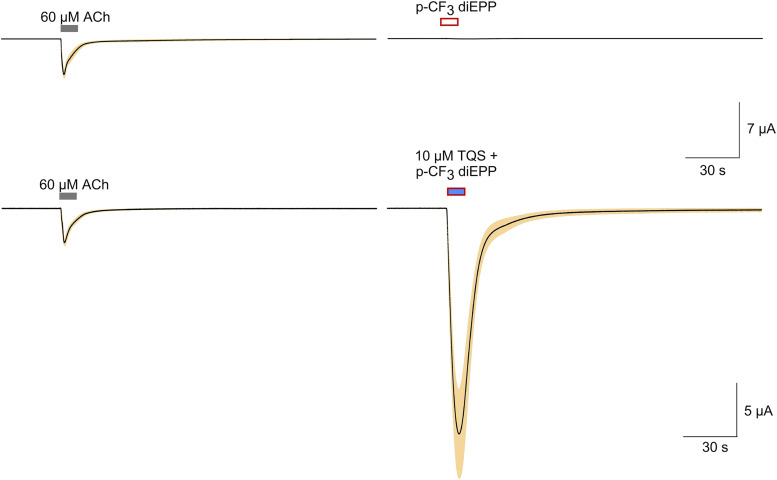
Fig. 2.
Multicell-averaged data traces for α7 responses induced by application of p-CF3 diEPP alone or coapplied with TQS. Averaged normalized responses to p-CF3 diEPP compared and scaled to ACh controls. The upper traces are the averaged responses of cells to 60 µM ACh (n = 5) obtained prior to the application of 30 µM p-CF3 diEPP. The average ACh control peak current amplitude was 5.05 ± 0.65 µA, as represented by the scale bar. The lower traces are the averaged responses of cells to 60 µM ACh (n = 8) compared with the averaged response to the coapplication of 30 µM p-CF3 diEPP and 10 µM TQS. The average ACh control peak current amplitude was 3.68 ± 0.76 µA, as represented by the scale bar. Each trace of 10,322 points is 206.44 seconds long. Responses of individual cells were each normalized to their responses to 60 µM ACh prior to the experimental applications; shown are the averaged normalized responses (solid lines) ± S.E.M. (tan area).

