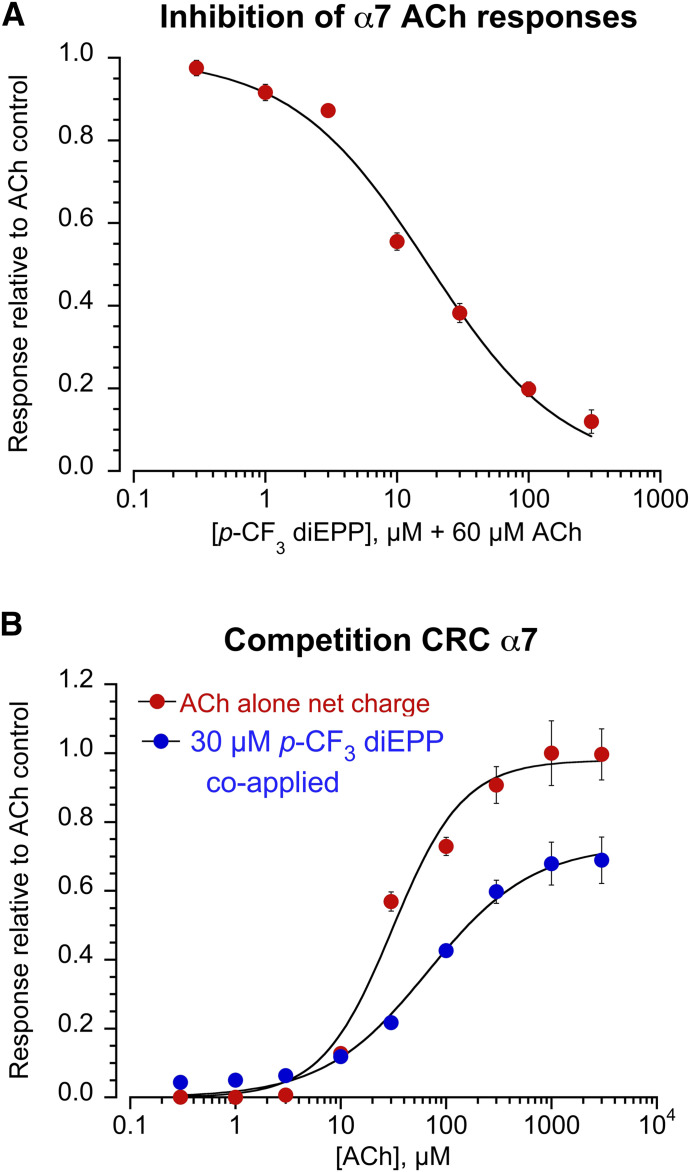
Fig. 4.
CRC data for the α7 nAChR antagonism induced by p-CF3 diEPP. The responses are reported as net charge and normalized to the average net charge value of two control applications of ACh (60 μM). (A) Inhibition CRC for p-CF3 diEPP at 0.3, 1, 3, 10, 30, 100, and 300 μM coapplied with 60 μM ACh. Each data point represents the average normalized response of at least four cells (±S.E.M.). (B) Competition CRC data (blue) for 30 µM p-CF3 diEPP coapplied with different ACh concentrations (0.3, 1, 3, 10, 30, 100, and 300 µM, and 1 and 3 mM). For comparison, ACh CRC data alone (red) are shown at the same concentrations.

