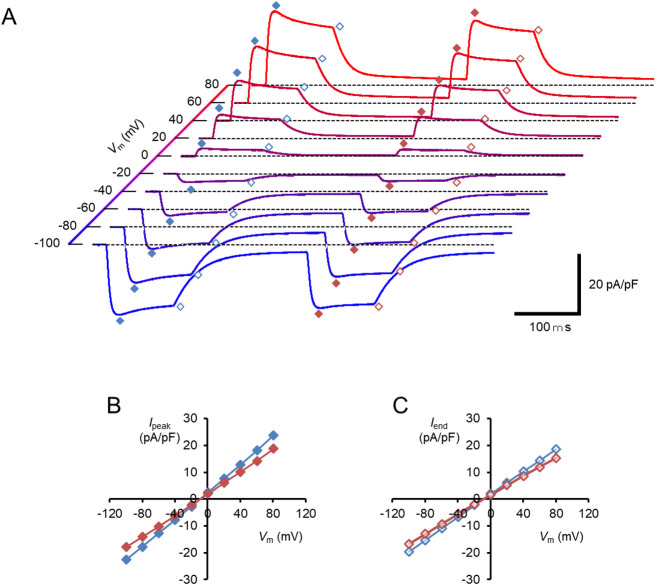
Figure 4.
The membrane current response of naïve hWR in a low Na+/Cl– milieu. (A) Each sample trace was the current response to the double light pulses at each Vm. The symbols indicate the Ipeak/Iend of the first responses (blue filled/open diamonds) and the Ipeak/Iend of the second responses (red filled/open diamonds), respectively. (B) I-V relations of the Ipeak; the first responses (blue symbols) and the second responses (red symbols). (C) I-V relations of the Iend; the first responses (blue symbols) and the second responses (red symbols).

