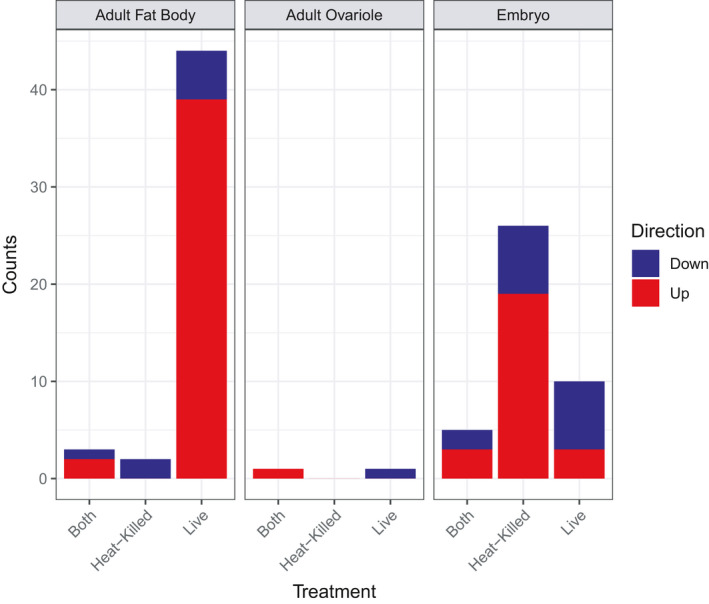
FIGURE 3.

Differentially expressed genes by tissue (fat body, ovariole, nd embryo), treatment group (saline, heat‐killed, and live), and direction (upregulated or downregulated). Fat body had the greatest number of differentially expressed genes, the largest number being upregulated in response to live Serratia exposure. Second to fat body in terms of number of differentially expressed genes was embryo, the largest number being upregulated in response to maternal treatment with heat‐killed Serratia. Few genes were differentially expressed for ovariole
