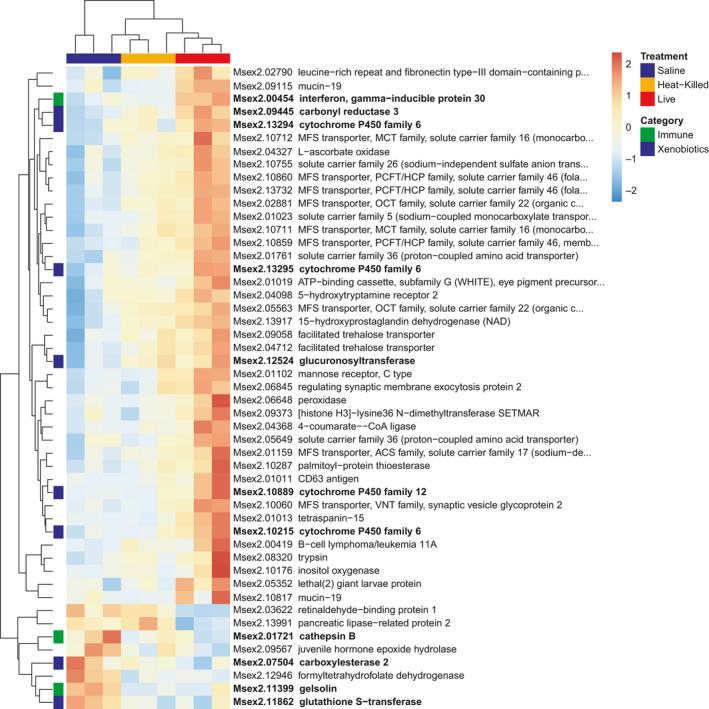
FIGURE 4.

Heatmap normalized gene expression of differentially expressed (DE) genes in the adult fat body with a log2‐fold change (LFC) greater than 2 or less than −2. Exposure treatments (saline, live Serratia, and heat‐killed Serratia) color coded across top of heatmap. Hierarchical clustering of genes shown along vertical axis with immune genes and xenobiotic genes coded in green and blue, respectively
