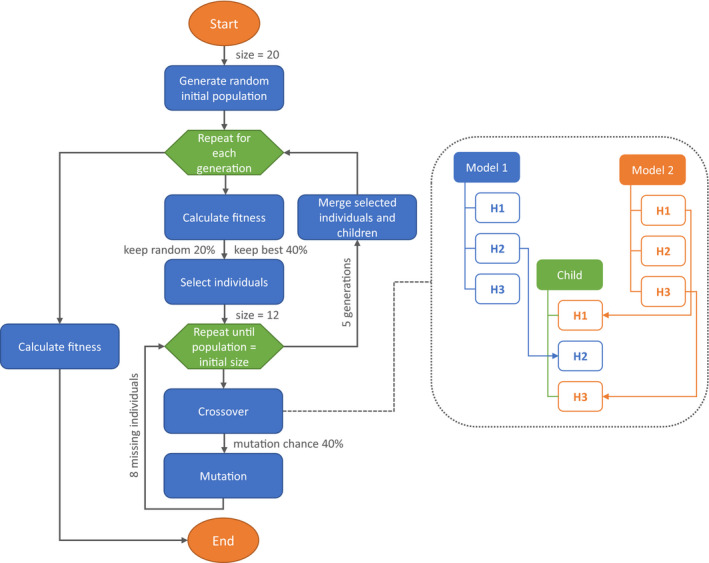
Figure 2.

Flowchart illustrating the steps of the genetic algorithm implemented in the function optimizeModel, with orange ovals representing the begin and the end of the algorithm, blue boxes the main operations executed by the algorithm, and the green hexagons the iteration loops. In gray are provided the default values used by the function, with “size” indicating the initial population size; “keep best” the proportion of best models retained; “keep random” the proportion of less performing models retained; “mutation chance” the probability that a mutation event occurs. Keep best and keep random are provided as proportion of the initial population size. The dotted box shows an example of crossover during which two models, randomly selected from the selected "individuals", are combined to generate a child model that inherits the first and third hyperparameters' values from Model 2 and the second from Model 1. When the number of generations is zero, the flowchart represents the algorithm implemented in the function randomSearch
