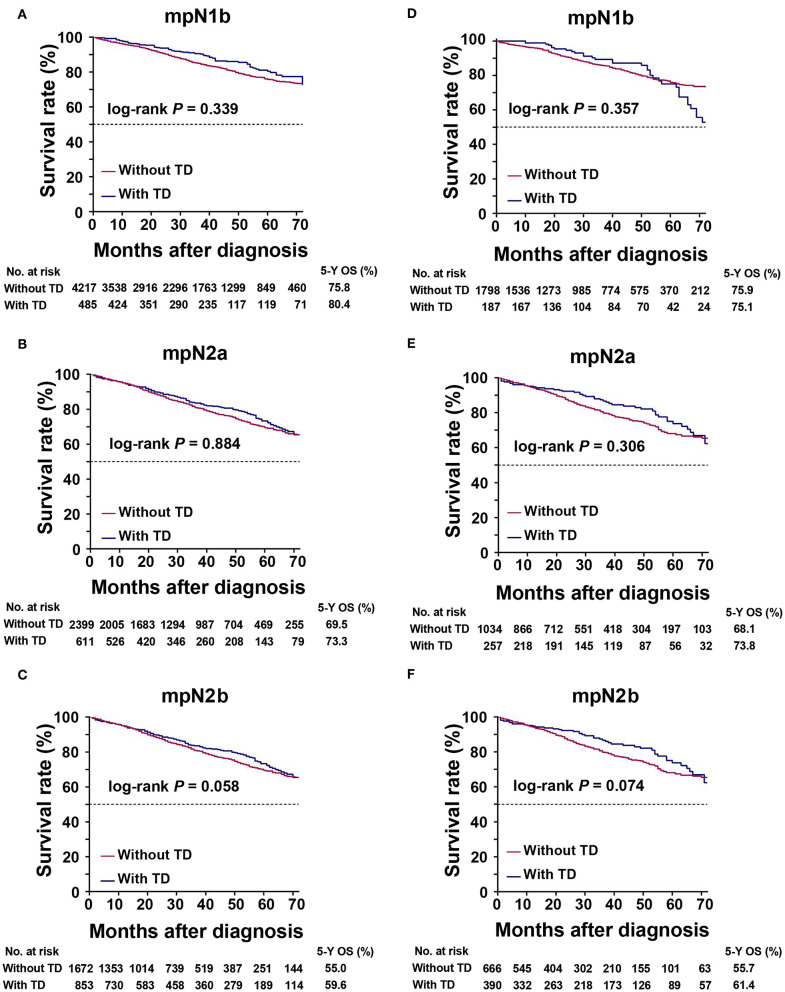
Figure 4.
Kaplan–Meier survival curves for patients with or without tumor deposits (TDs) in the same mpN stages. (A) mpN1b in the training cohort; (B) mpN2a in the training cohort; (C) mpN2b in the training cohort; (D) mpN1b in the validation cohort; (E) mpN2a in the validation cohort; (F) mpN2b in the validation cohort.

