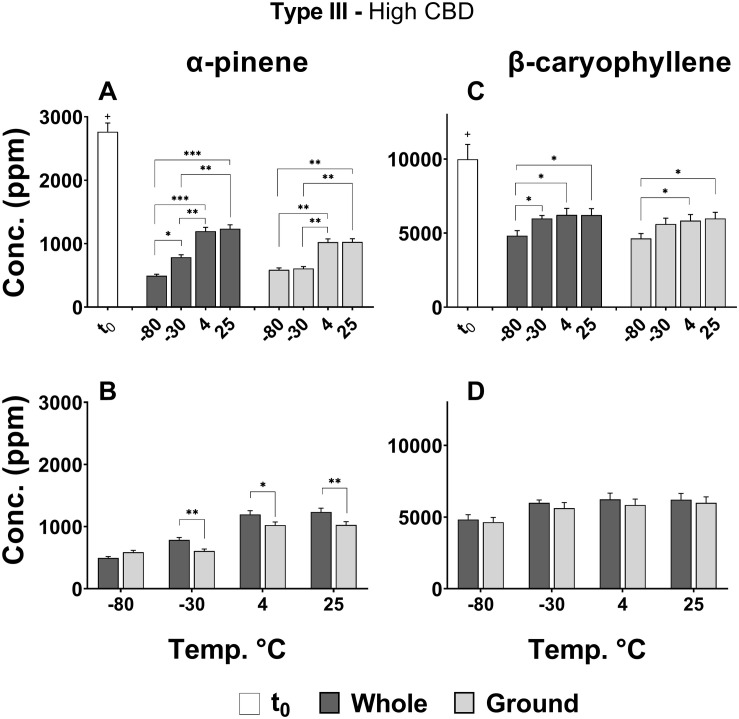
FIGURE 5.
Comparison of (A,B) α-pinene and (C,D) β-caryophyllene concentrations in whole and ground Type III Cannabis inflorescences at t0 and after 4 months of storage (t4) at different temperatures. The two terpenoids were quantified by SHS-GC/MS/MS. Statistically significant differences between (A,C) storage temperatures and (B,D) physical form were calculated by two-way ANOVA followed by a Sidak post hoc multiple comparison test (*p < 0.05, **p < 0.005, ***p < 0.0005). Statistically significant differences between t0 and t4 were observed for all treatments and temperatures (+p < 0.0005).

