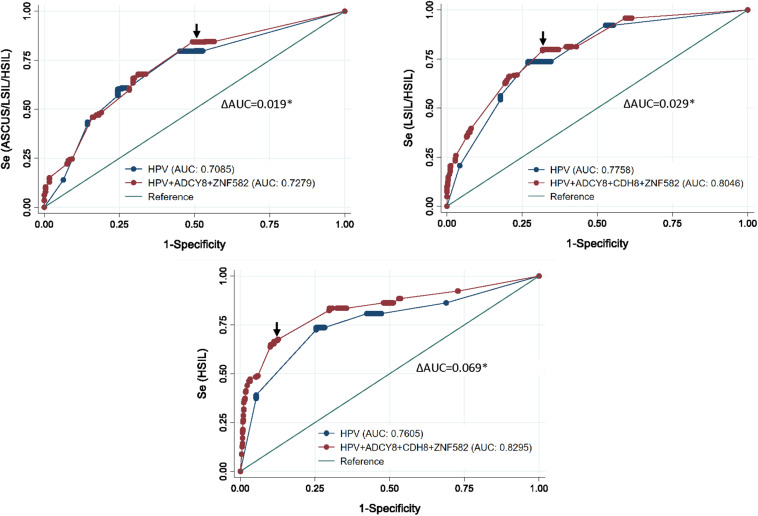
FIGURE 5.
Receiver operating characteristic (ROC) curve analysis after multivariable logistic regression for three logit models. Top left, the ROC curve revealed the best predictors to differentiate between NILM and ASCUS/LSIL/HSIL as HPV carcinogenicity, ZNF582_1st CpG site, and ADCY8_5th CpG site. Top right, for differentiating between NILM/ASCUS and LSIL/HSIL cytology, the best multivariate predictor was the combination of HPV carcinogenicity, ZNF582_1st CpG site, CDH8_4th CpG site, and ADCY8_5th CpG site. Bottom, for differentiating between NILM/ASCUS/LSIL and HSIL cytology, the best multivariate predictor was the combination of HPV carcinogenicity, ZNF582_1st CpG site, CDH8_4th CpG site, and ADCY8_6th CpG site. All three multivariable models were better predictors of the specified outcome than HPV carcinogenicity alone (delta AUC*, p < 0.05, chi-square test). AUC, Area under the receiver operator curve (AUC); se, sensitivity; cut-off points (arrows).

