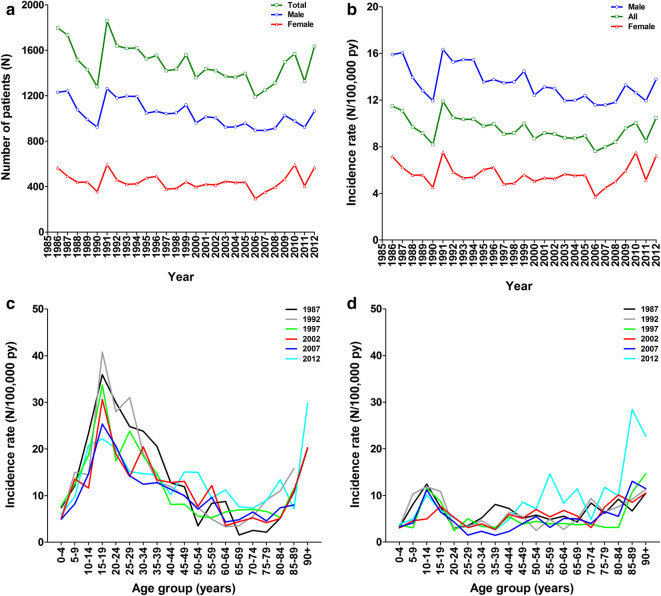
Fig. 1.
Case numbers (a), incidence rates (per 100,000 person years) of isolated tibia shaft fractures annually since 1991 (b), and age relation in males (c) and females (d). a, b The crude numbers of patients and the incidence rate per year from 1991 to 2012, respectively. The age-dependency of the incidence rate for every fifth year during the study period in males (c) and females (d)

