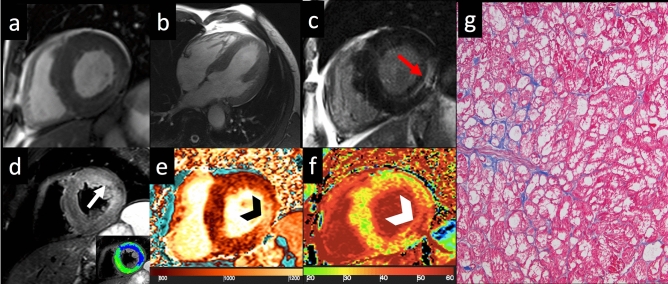
Fig. 4.
Anderson–Fabry disease—Cine-SSFP in short axis (a) and four-chamber (b) views acquired on end-diastolic phase demonstrate an asymmetrical hypertrophy with predominant involvement of septum (IVS maximal thickness: 20 mm). On LGE image (c), an area of mid-myocardial enhancement is detected in the LV inferolateral wall (red arrow). STIR T2-weighted image (d) shows an area of myocardial edema located in LV antero-lateral wall, with a subendocardial distribution pattern (white arrow), confirmed by the blue area (T2 ratio > 2) in the panel at the bottom. The analysis of nT1 (e) map demonstrates severe reduction in global nT1 (reddish brown color, nT1: 877 ± 23 ms, normal value for our scanner 970–1020 ms) except for the focus of increased nT1 at inferolateral wall (nT1: 1116 ms, black arrowhead) matching the area of increase in ECV (white arrowhead, ECV: 48%) on relative map (f, global ECV: 27%). Hematoxylin and eosin histology (g, ×200) shows cardiomyocytes hypertrophy, caused by large cytoplasmic and perinuclear vacuoles, containing myelin bodies. Cine-SSFP steady-state free precession images; IVS interventricular septum; LGE late gadolinium enhancement; STIR short tau inversion recovery; LV left ventricle; nT1 native T1 map; ECV extracellular volume fraction

