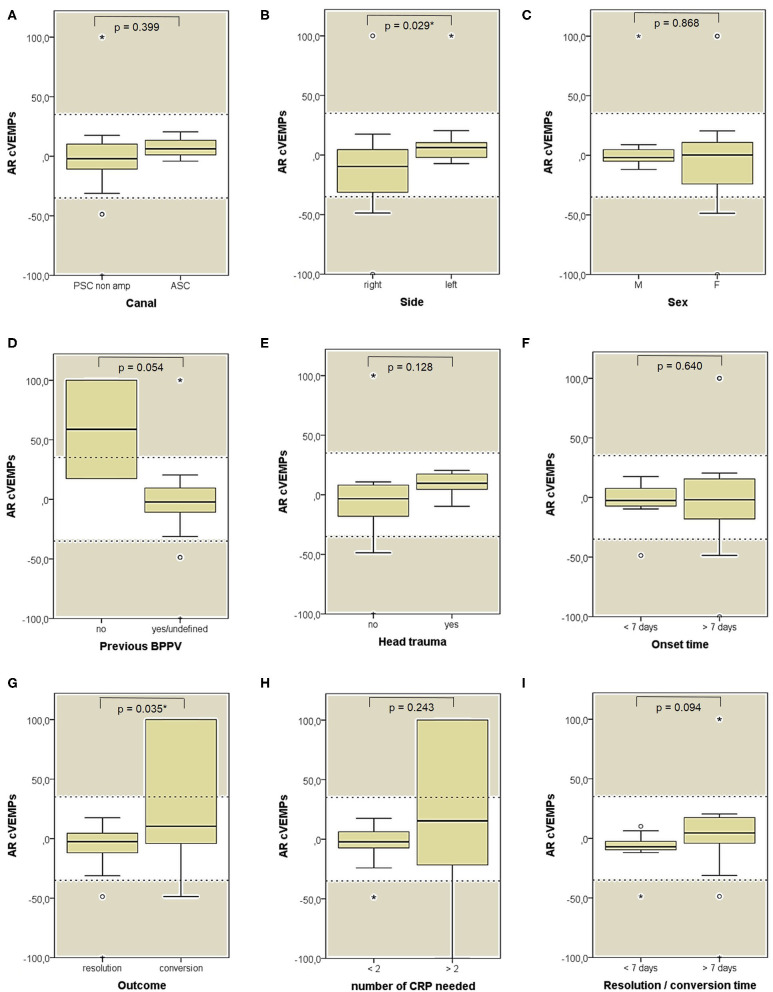
Figure 12.
Box plots correlating medians of AR values for air-conducted cervical VEMPs values among 26 patients submitted to electrophysiological testing, divided according to different features. (A) Affected semicircular canal. (B) Affected side. (C) Gender. (D) History of recent BPPV. (E) History of recent head trauma. (F) Onset time. (G) Outcome. (H) Number of CRP needed to restore or convert pDBN. (I) Time needed for resolution or conversion of pDBN. Statistically significant differences at the Mann-Whitney U-test are reported and highlighted with for p < 0.05. Horizontal dashed lines represent the border between normal and pathologic AR values for cervical VEMPs (35%) and values within gray areas represent abnormal measurements. AR, asymmetry ratio; ASC, anterior semicircular canal; BPPV, benign paroxysmal positional vertigo; CRP, canal repositioning procedures; cVEMPs, cervical vestibular-evoked myogenic potentials; F, female; M, male; pDBN, positional downbeat nystagmus; PSC non-amp, posterior semicircular canal non-ampullary arm. Statistically significant differences at the Mann-Whitney U-test are reported and highlighted with * for p < 0.05. Values at a greater distance from the median than 1.5 times and 3 times the IQR are plotted individually as dots (weak outliers) and asterisks (strong outliers), respectively.

