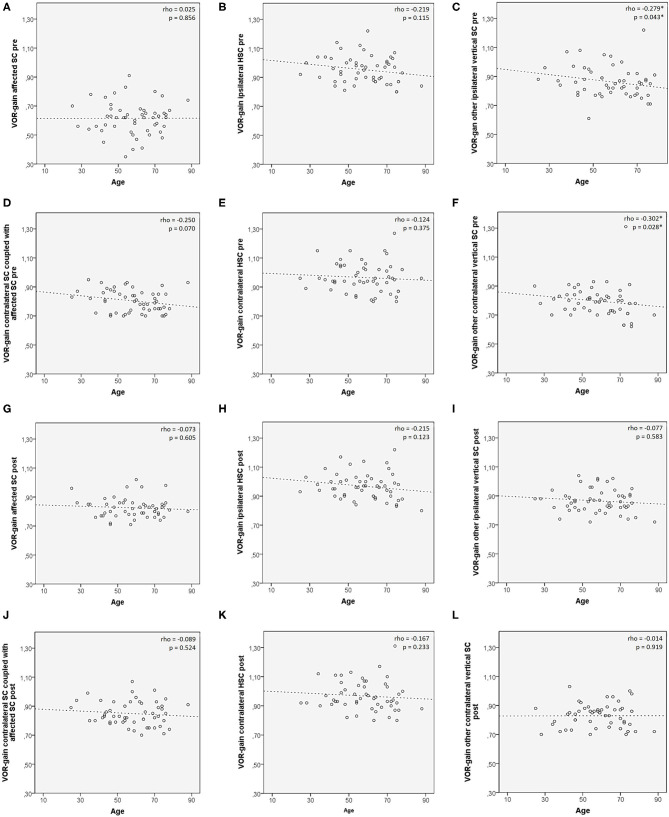
Figure 3.
Scatter plots correlating patients' age among 53 patients with identified affected SC with presenting VOR-gain (A–F) and post-treatment VOR-gain (G–L) for each semicircular canal. Each plot shows the linear regression line with corresponding Spearman's correlation coefficient (ρ). p < 0.05 are reported and marked with *. HSC, horizontal semicircular canal; post, post-treatment; pre, at presentation; SC, semicircular canal; VOR, vestibule-ocular reflex.

