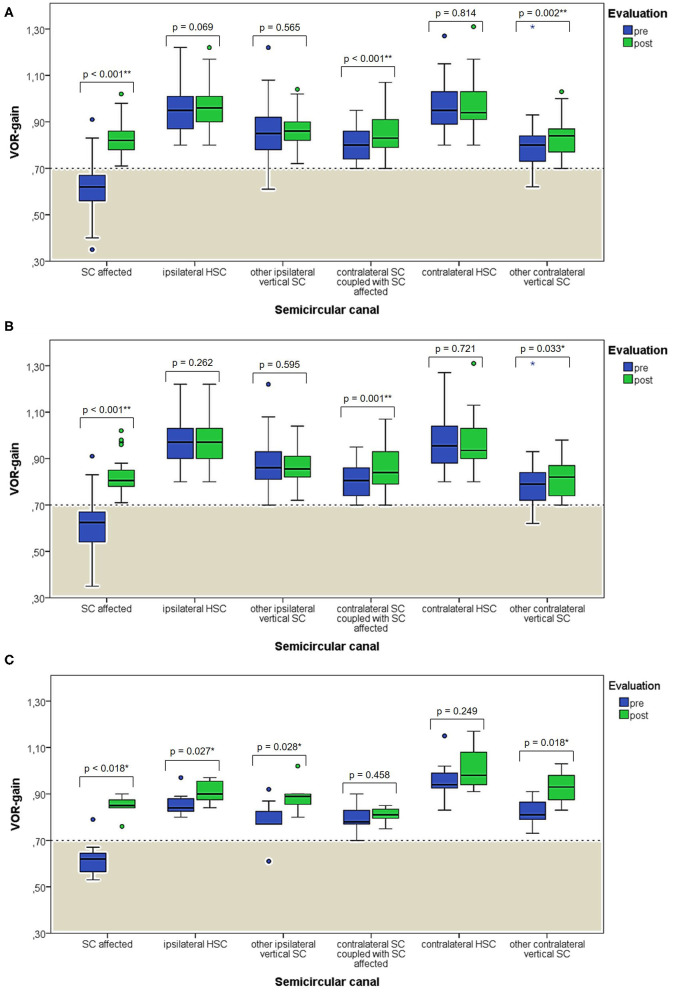
Figure 5.
Box plots correlating medians of VOR-gain values at presentation and following physical therapy for each semicircular canal among overall 53 subjects with identified affected SC (A). The same correlation is shown considering either only cases with apogeotropic PSC-BPPV (B) or ASC-BPPV (C). Horizontal dashed lines represent the border between normal and pathologic VOR-gain values for vertical canals (0.7) and values within gray areas represent abnormal measurements. Statistically significant differences at the Wilcoxon signed-rank test are shown. p < 0.05 and < 0.01 are marked with * and **, respectively. ASC, anterior semicircular canal; BPPV, benign paroxysmal positional vertigo; HSC, horizontal semicircular canal; post, post-treatment; pre, at presentation; PSC, posterior semicircular canal; SC, semicircular canal; VOR, vestibulo-ocular reflex. Values at a greater distance from the median than 1.5 times and 3 times the IQR are plotted individually as dots (weak outliers) and asterisks (strong outliers), respectively.

