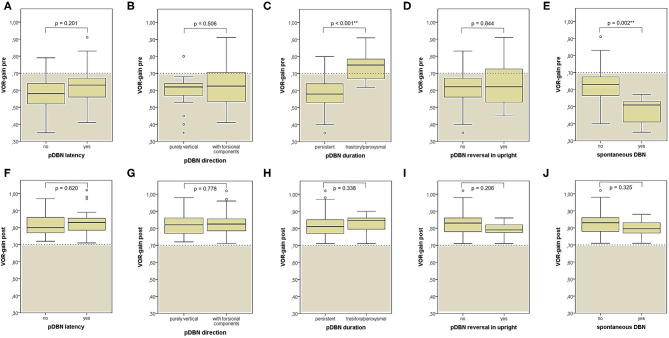
Figure 9.
Box plots correlating medians of VOR-gain values at presentation (A–E) and following physical treatment (F–J) for the SC involved by BPPV among overall subjects (53) with identified affected canal divided based on different VOG findings at presentation. Statistically significant differences at the Mann-Whitney U-test are reported and highlighted with **p < 0.01. BPPV, benign paroxysmal positional vertigo; post, post-treatment; pre, at presentation; pDBN, positional downbeat nystagmus; SC, semicircular canal; VOG, video-oculography; VOR, vestibulo-ocular reflex. Values at a greater distance from the median than 1.5 times and 3 times the IQR are plotted individually as dots (weak outliers) and asterisks (strong outliers), respectively.

