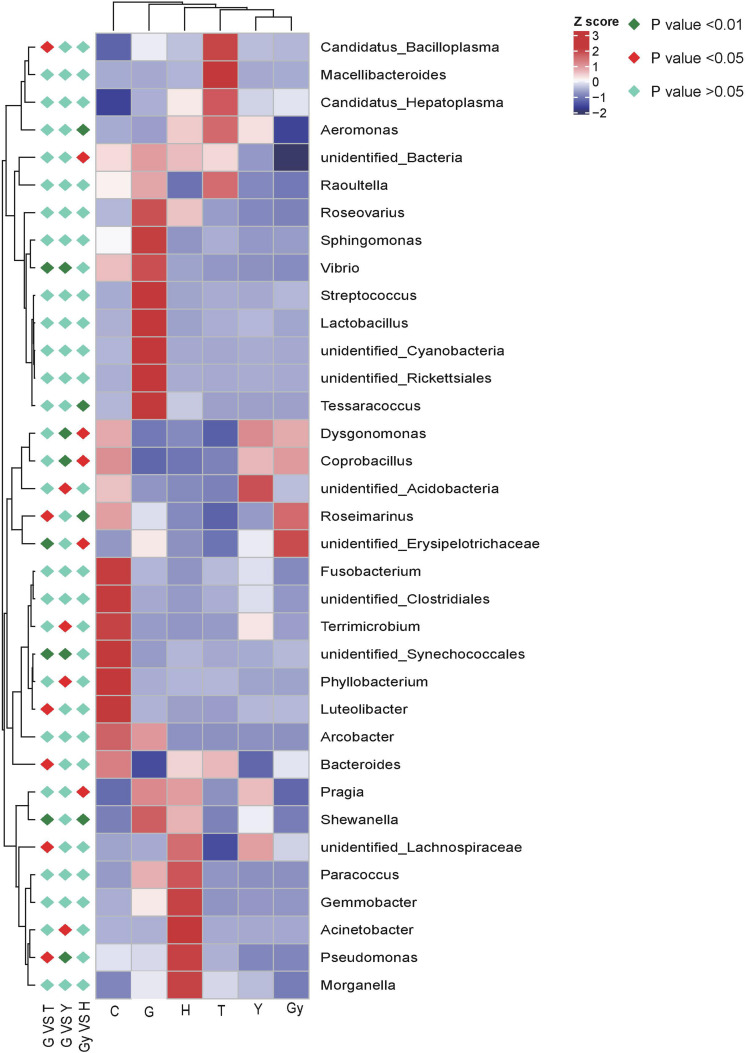
FIGURE 4.
Heat map of the correlation matrix between crab population and the bacteria communities. Red orange tones indicate a positive correlation between crab population and the bacteria communities; blue and yellow white indicate absence of correlation as for example, pragia has no correlation with crabs from Gy, meaning pragia was not found in crabs from Gy.

