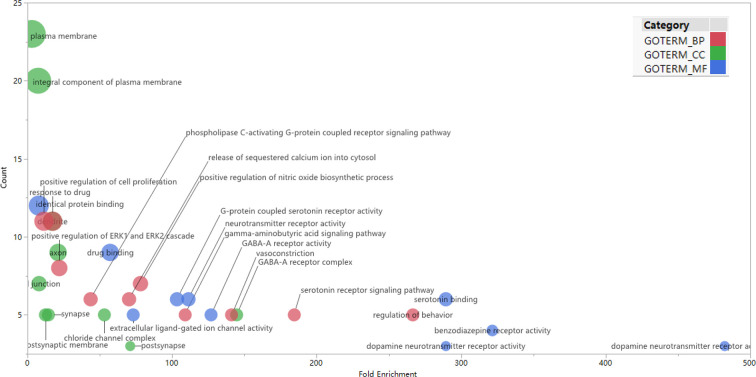
Figure 3.
Top 10 significantly enriched GO terms in biologic process (red), cellular components (green), and molecular function (blue) categories. The bubble diagram was made using JMP software 14.2.0 (SAS Institute Inc., USA). The bubble size is proportional to its involved targets percentage in the term.

