
Figure 1.
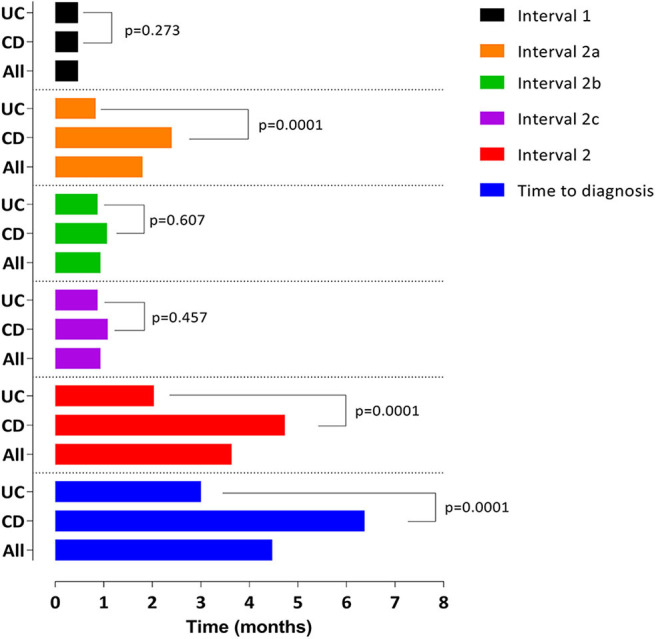
Graphical representation of the median duration (months) of time to diagnosis and the corresponding subintervals. Interval 1 (days): All: 13.8 (6.9–32.4), CD: 13.8 (6.9–57.9), UC 13.8 (7.2–30.6), p = 0.273. Interval 2a (months): All: 1.8 (0.66–5.06), CD: 2.4 (1.03–7.17), UC: 0.83 (0.30–2.50), p = 0.0001. Interval 2b (days): All: 7 (1–31), CD: 7.5 (1–31), UC: 7 (1–29), p = 0.607. Interval 2c (days): All: 14 (6–34), CD: 14 (6–49), UC: 14 (5–29), p = 0.457. Interval 2 (months): All: 3.6 (1.8–8.7), CD: 4.7 (2.4–9.8), UC: 2.0 (1.0–4.9), p = 0.0001. Time to diagnosis (months): All: 4.4 (2.6–10.4), CD: 6.3 (3.3–12.3), UC: 3 (1.6–5.6), p = 0.0001.