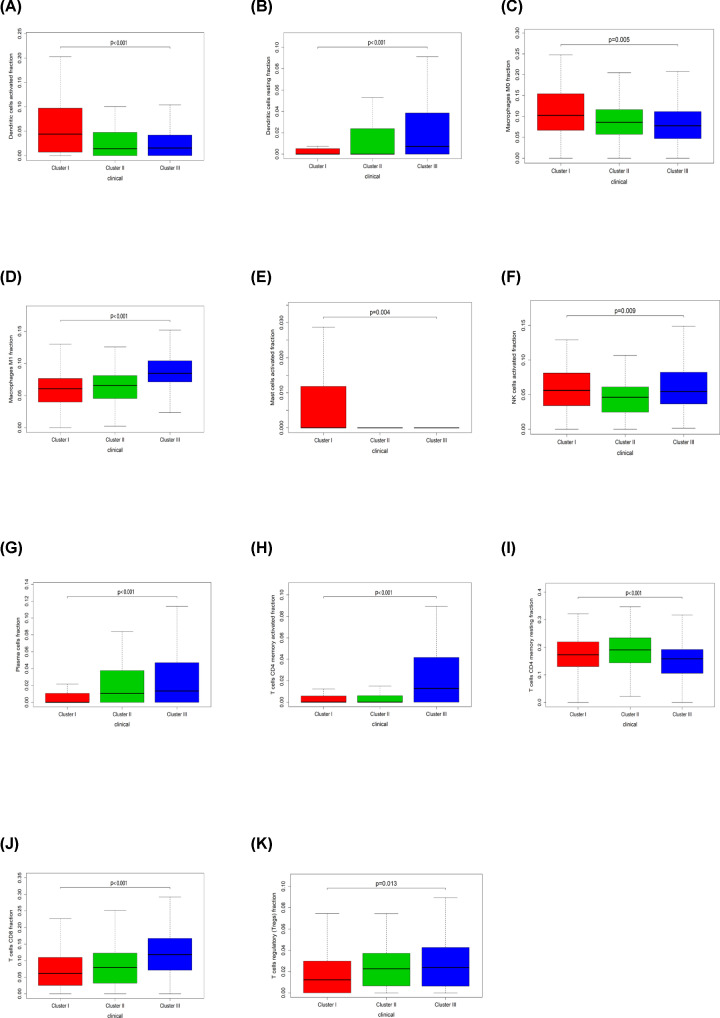
Figure 11. Box plot describing the relationship between immune cell subset and three ovarian cancer clusters.
(A–K) is for Dendritic cells activated, Dendritic cells resting, Macrophages M0, Macrophages M1, Mast cells activated, NK cells activated, Plasma cells, T cells CD4 memory activated, T cells CD4 memory resting, T cells CD8, and T cells regulatory (Tregs), respectively.

