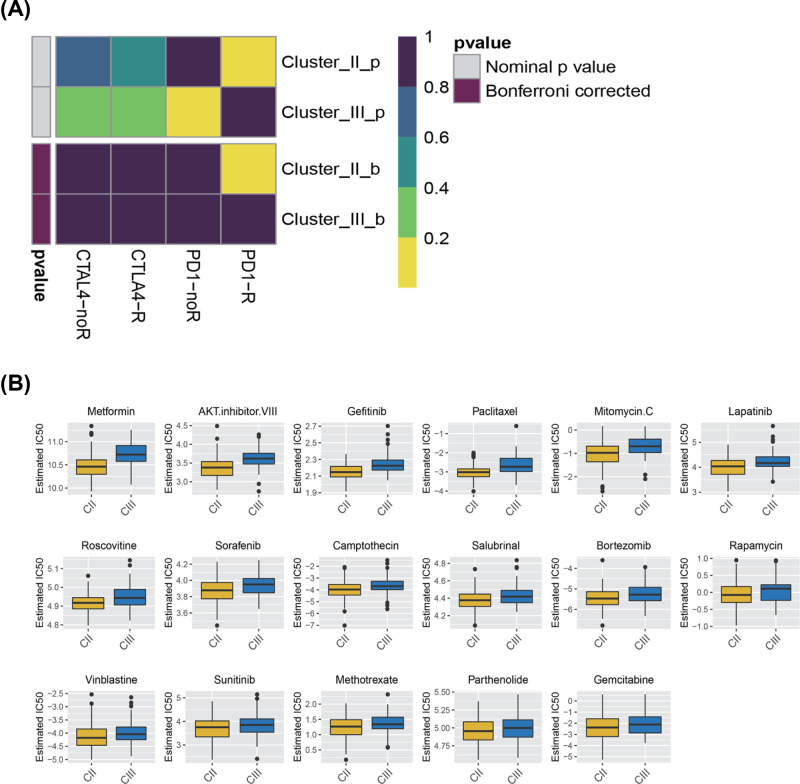
Figure 14. Inferred predictive response for immunotherapy and anti-cancer drugs among three ovarian cancers subtypes.
(A) Submap analysis revealing that Cluster II would be more sensitive to checkpoints PD-1 immunotherapy (Bonferroni-corrected P<0.05). (B) Box plots manifesting the estimated IC 50 for anti-cancer drugs.

