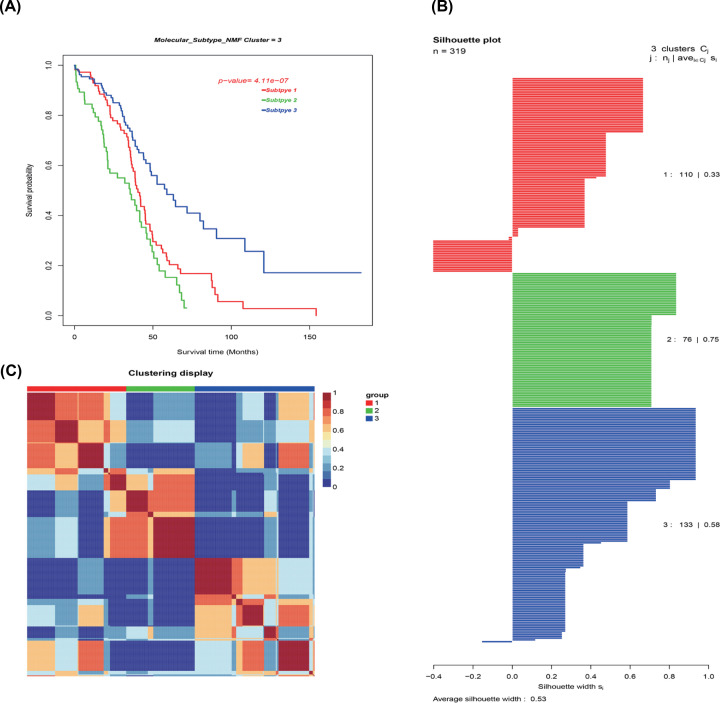
Figure 8. Identification of ovarian cancer molecular subtypes utilizing SNFCC+ algorithm.
(A) Log-rank test P value for Kaplan–Meier survival analysis. (B) Average silhouette width reflecting the coherence of clusters. (C) Clustering heatmap exhibiting the extent of the partitioning of the sample clusters.

