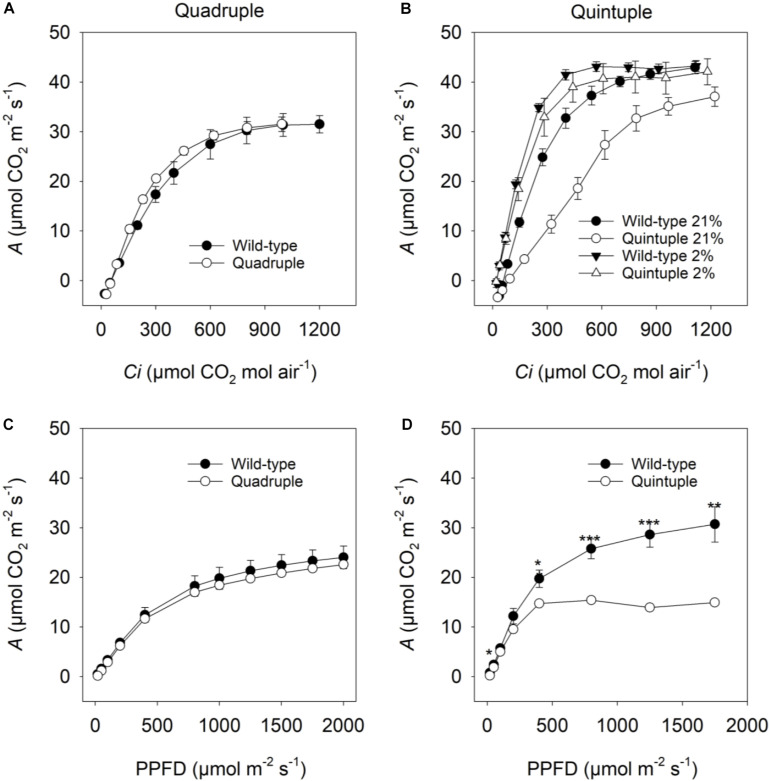
FIGURE 3.
(A,B) Net CO2 assimilation rate (A) in response to intercellular pCO2 (Ci) and (C,D) photosynthetic photon flux density (PPFD). Measurements (A,B) were made at 2000 μmol photons m–2 s–1 under 21% O2 (A,B) and 2% O2 (B). Measurements (C,D) were made at a pCO2 (Ca) of 400 μmol CO2 mol air–1. Values are means ± SE of three F2 cross plants and three wild-type (WT) plants for quadruple comparisons and seven F2 cross plants and four WT plants for quintuple comparisons. A Student’s t-test was performed for (C,D). Significant differences between WT and quintuple within PARi level are indicated by *P-value < 0.05, **P-value < 0.01, ***P-value < 0.001.

