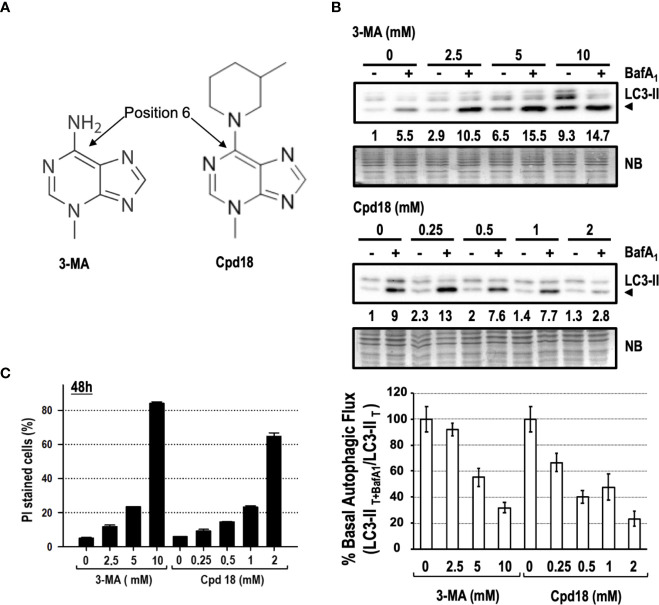
Figure 7.
Concentration-dependent cytotoxicity of 3-methyladenine and its structural derivative Cpd18. (A) Chemical structure of 3-MA and Cpd18 (images borrowed from Selleckchem and MerckMillipore webpages, respectively). (B) Western blot of MEFs protein extracts treated for 8 h with growing concentrations of 3-MA and Cpd18 in the presence (+) or absence (–) of 100 nM BafA1 for the whole treatment. Intensity of the LC3-II band, normalized to the loading of each lane (naphtol blue staining) and referred to “0” without BafA1, was shown. Western blots are a significant experiment out of three independent experiments. A histogram representing “% Basal Autophagic Flux (LC3-II T+BafA1/LC3-II T)” was calculated as reported in the “MATERIAL and METHODS” section. The percentages represent the quotient between LC3-II band intensities in “T” and “T+ BafA1”. “T” is treatment and “T+ BafA1”is treatment in the presence of BafA1. Naphthol blue (NB) stained membrane served as a loading control. The percentage of basal autophagic flux is expressed as mean ± SEM of at least three independent experiments (n = 3). (C) MEFs were treated with the concentrations of 3-MA and Cpd18 indicated in the panel. After 48 h, the percentage of propidium iodide (PI)-positive cells (dead cells) was determined by flow cytometry. Bar value is the mean ± SEM (n = 3).

