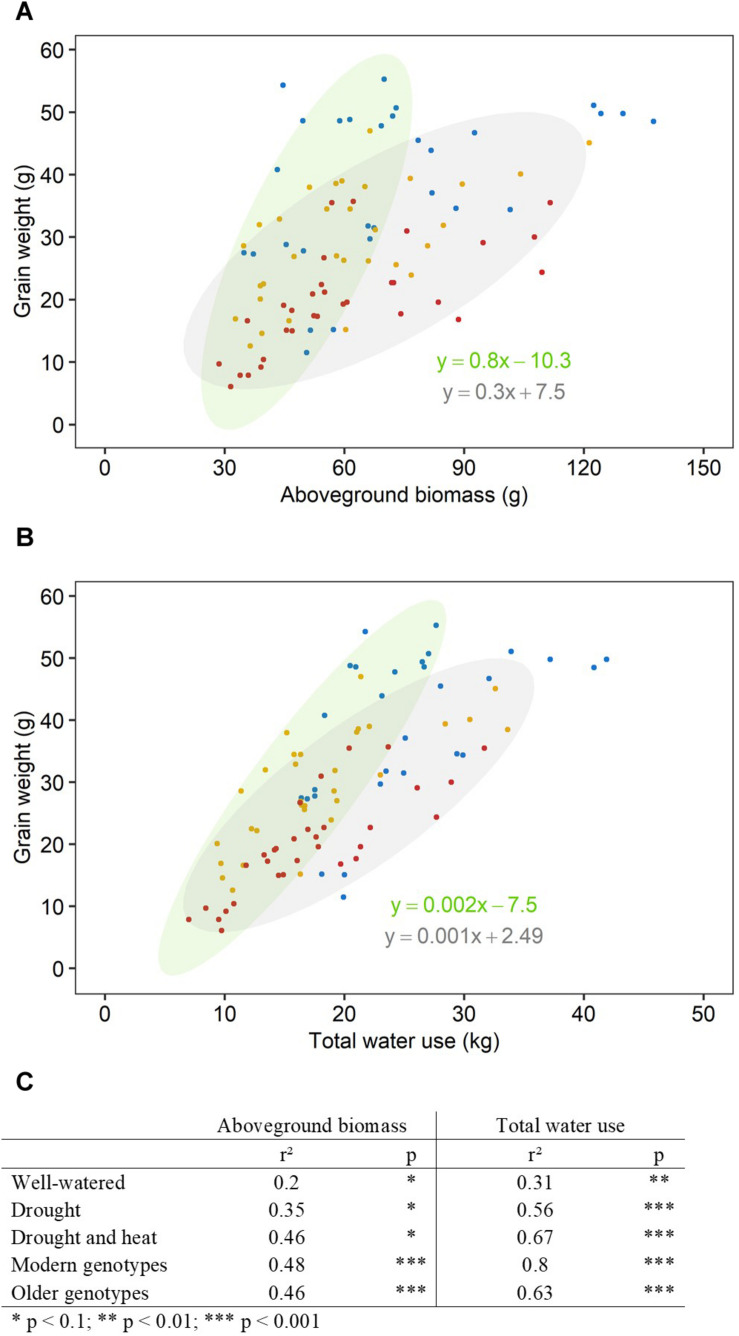
FIGURE 2.
Aboveground biomass and water use explained more of the variation in grain weight under increasing stress intensity than in well-watered conditions. Relationships between final grain weight per plant and (A) final aboveground biomass excluding grains, (B) total water use. Each point represents one plant, grown under well-watered conditions (blue), drought (orange) or combined drought and heat stress (red). Ellipses circle modern genotypes (in green) and older genotypes (in gray). Linear regression equations correspond to linear regression for modern genotypes (in green) and older genotypes (in gray). (C) Table shows r2 and p-value of linear regressions (*p < 0.1, **p < 0.01, ***p < 0.001) for each treatment (well-watered, drought, combined drought, and heat stress) and genotype group (modern, older).

