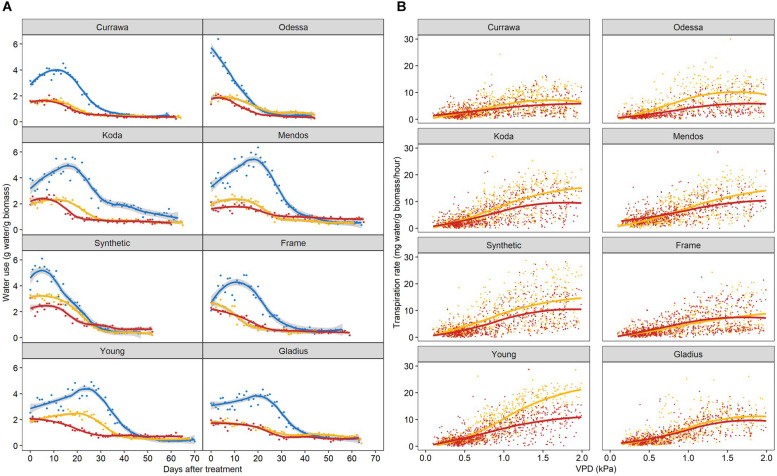
FIGURE 5.
Interaction of high temperature and drought differentially reduced daily water use and transpiration response to vapor pressure deficit. (A) Daily water use per plant estimated as total irrigation per day, normalized to aboveground biomass. Plants grown in well-watered conditions (blue), drought (orange), or in drought following 3-day heat stress (red). 0 DAT is the first day post-heat treatment (12 days after anthesis). Trend lines are loess regressions. Values are means of four replicates (n = 4). The confidence interval (0.95) is displayed around smoothed regressions in gray. (B) Hourly transpiration rate response to VPD normalized to aboveground biomass. Plants grown in drought (orange) or in drought following 3-day heat stress (red). Graphs include data from 0 to 30 DAT. Trend lines are smooth regression lines.

