Figure 1.
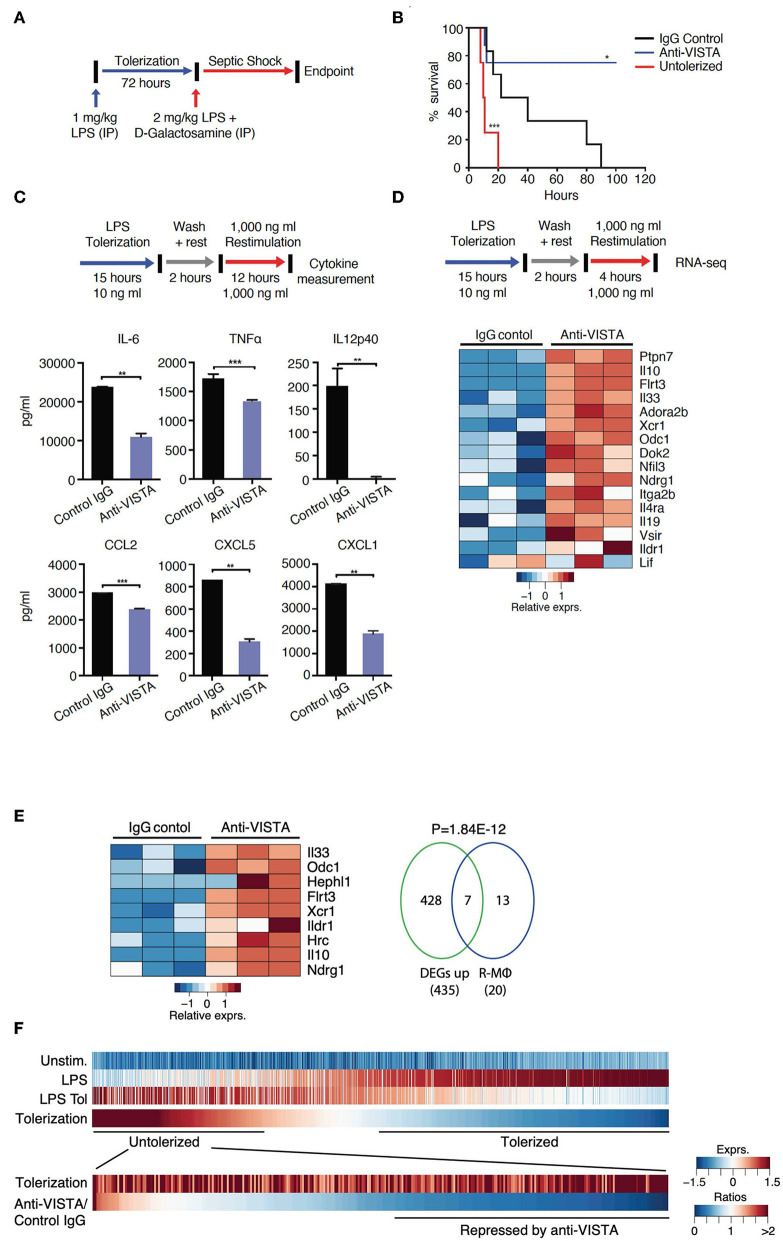
VISTA targeting augments LPS tolerance in vivo and in vitro. (A) Anti-VISTA enhances LPS-induced tolerance in a model of LPS-induced septic shock. Mice were partially tolerized using 1 mg/kg LPS in the presence of anti-VISTA or control IgG for 72 h followed by the induction of septic shock using 2 mg/kg LPS + D-galactosamine and monitored for survival (top). (B) Survival of mice following treatment with control Ig, anti-VISTA or non-tolerized (n = 8/group in the antibody treatment and n = 4 for untolerized mice control). This experiment is a representative of 3 independent repeats with p-values calculated by log rank test (bottom). P-value of anti-VISTA treatment vs. Isotype IgG control treatment is 0.0194 whereas p-value of untolerized compared to antibody treatment is 0.0004 (C) Anti-VISTA enhances a tolerogenic profile in LPS-treated BMDMs in vitro. Anti-VISTA or control Ig-treated BMDMs (1 × 10⁶ cells/ml per well in a 6 well plate) were tolerized by treatment with 10 ng/ml LPS for 15 h, washed and rested for 2 h, then stimulated by 1 μg/ml LPS for 12 h. Luminex analysis was performed on supernatant. This data is representative of three independent repeats with three biological samples of pooled BMDMs. Each bar indicates the mean value, and each error bar refers to one standard deviation (SD). Student's t-tests were performed on anti-VISTA vs. Control IgG samples. (D) Differential gene expression in anti-VISTA treated LPS activated BMDMs. BMDMs were treated for 15 h with LPS and control Ig or anti-VISTA, rested for 2 h and restimulated with LPS (top). Heat map of RNA expression (RNA-seq) of selected differentially expressed genes from anti-VISTA vs. control IgG treated BMDMs after 4 h of restimulation with LPS following LPS tolerance (bottom). (E) Anti-VISTA induces a regulatory macrophage transcriptional profile. Comparison between Anti-VISTA treated tolerized BMDM profile vs. Regulatory BMDM previously reported (14). P-value calculated by hypergeometric test. These experiments are representative of three independent repeats with three biological samples per repeat. (F) Anti-VISTA expands the breadth of LPS tolerizable genes. Genes induced by LPS stimulation (“LPS”) compared to unstimulated (“Unstim.”) were identified and classified as non-tolerized (red) or tolerized by LPS pretreatment (blue) (“LPS Tol”) in BMDMs (as described in (C). The extend of tolerization was determined by the ratio of “LPS tol” and “LPS” (“Tolerized”). Genes non-tolerized by LPS were further evaluated for expression upon anti-VISTA treatment (“Anti-VISTA/Control IgG”). Statistical significance of *P ≤ 0.05, **P ≤ 0.01, ***P ≤ 0.001, whereas ****P ≤ 0.0001.

