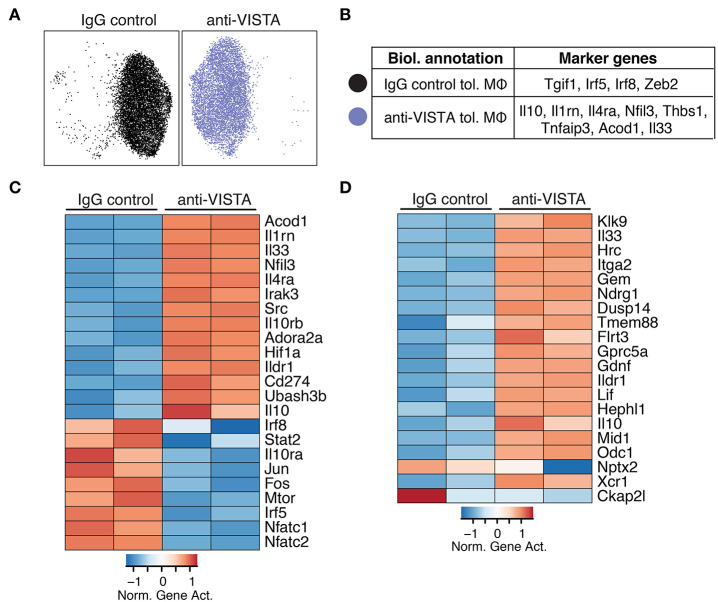
Figure 2.
Anti-VISTA alters the epigenetic profile of tolerized BMDM. (A) Anti-VISTA alters the epigenetic steady state of tolerized BMDMs. UMAP plot of scATAC-seq on anti-VISTA agonist or IgG isotype control treated LPS-tolerized BMDMs 15 h after treatment with tolerizing LPS dose (10 ng/ml). Data is representative of ~10,000 cells from 2 independent biological samples per group. (B) Representative genes that define the clusters identified by scATAC-seq analysis presented in (A). (C) Anti-VISTA induces global changes in the epigenetic profile of tolerized BMDMs. Heatmap presenting global differences in gene activity between anti-VISTA vs. IgG control in LPS-tolerized BMDMs. (D) Anti-VISTA induced a regulatory macrophage profile. Comparison between Anti-VISTA treated tolerized BMDM profile vs. Regulatory BMDM previously reported (14). This data is representative of two independent repeats with two biological samples per group for each repeat.

