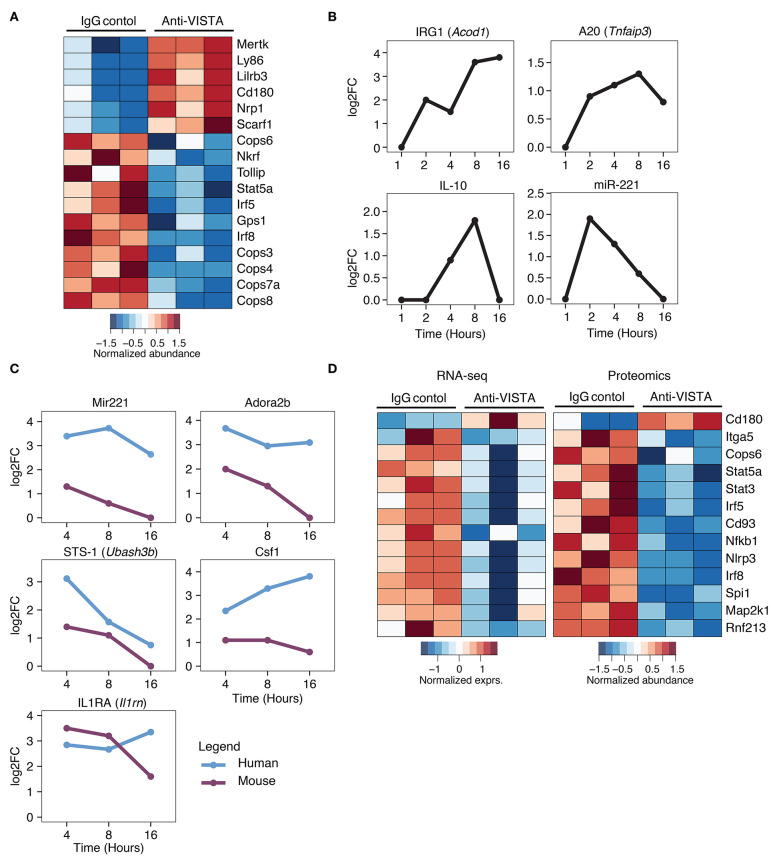
Figure 5.
Comparative analysis of anti-VISTA alterations in the proteome and transcriptome of human monocytes and mouse macrophages. (A) Anti-VISTA agonist induces a tolerogenic proteomic profile in BMDMs. Heatmap presenting quantified global proteomic changes in BMDMs treated with anti-VISTA agonist (803) for 30 min (details in Methods). Multiple sample test with FDR <0.05 revealed 1,581 proteins that were significantly changing between two study groups. Data is representative of compiled three biological independent repeats of pooled BMDMs (10 × 106 cells per sample). (B) Anti-VISTA induced changes in the transcriptional expression of genes involved with LPS-induced macrophage tolerance. Kinetics of mRNA expression of the genes Acod1, Tnfaip3, Il10, and miR-221 from a time-course assessment of anti-VISTA treatment of BMDMs at 1, 2, 4, 8, and 16 h by total RNA-seq. (C) Comparative analysis of anti-VISTA alterations in the transcriptional expression of miR-221, Adora2b, Ubash3b, Csf1, and Il1rn in human and mouse macrophages. The log2 fold change (log2FC) of differentially expressed genes comparing Anti-VISTA agonist and Control IgG-treated BMDM and monocyte derived human macrophage were compared. Kinetics of mRNA expression of the genes miR-221, Adora2b, Ubash3b, Csf1, and Il1rn upregulated by both mouse BMDMs and human monocytes after anti-VISTA treatment. (D) Anti-VISTA induces similar changes in gene expression when analyzed at both the transcriptional and proteomic levels. Heatmap presenting common genes differentially expressed after anti-VISTA treatment at both the proteomic level from the same dataset in (A) and by RNA-seq after LPS stimulation (from data presented in Figure 3).

