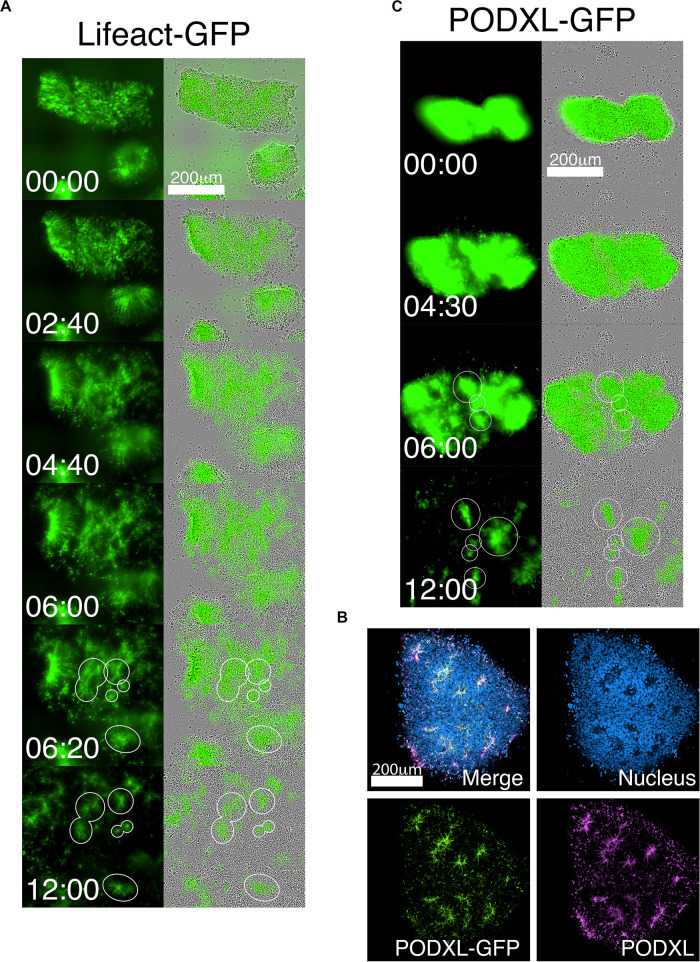
FIGURE 3.
Live-tracking of NPC rosette morphogenesis. (A–C) Live imaging of 1196a hiPSC expressing Lifeact-GFP (A) or PODXL-GFP (C) for 12 h after colonies were allowed to reattach for 2 h. (B) Confocal images of PODXL-GFP NPC rosettes stained with anti-PODXL. GFP localization mirrors endogenous PODXL localization. Note that, while a uniform prominent GFP signal is initially seen throughout the apical surface of the recently plated colony, at later time points, GFP-enriched regions are concentrated at the constricted centers of the rosettes (lumen). It is likely that, as the colony expands rapidly, the apical surface area of non-rosette cells dramatically increases, resulting in reduced GFP signal intensity per unit area. Scales as indicated.

