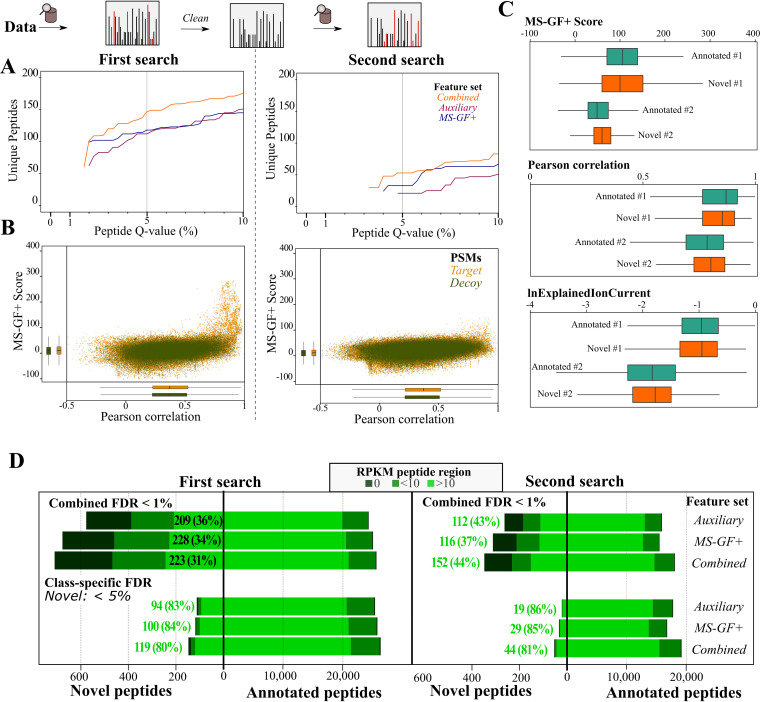
FIG 4.
Unannotated peptide identification using a chimeric postprocessing pipeline. (A) Number of nonredundant peptides (y axis) at Percolator peptide Q-value thresholds (x axis) in the first and second searches. Percolator was run in parallel using the default MS-GF+ features (blue), the auxiliary features (purple), and the combined feature set (orange). (B) Scatter plot of MS-GF+ RawScore and Pearson correlation (spec_pears_norm by reScore [22]) (Table S1) for PSMs in the two search rounds. Only features for the PSM with highest Percolator recalibrated score after postprocessing using the combined feature set are shown. (C) Distributions of MS-GF+ score, Pearson correlation, and logged explained ion current (lnExplainedIonCurrent) distribution for PSMs with Q values below 1% (combined feature set) for annotated peptides (green) or below 5% for unannotated peptides (orange). (D) Ribo-seq coverage for annotated and novel peptides identified in the first and second searches using different feature sets for combined FDR or class-specific FDR estimation. Ribo-seq reads per kilobase of transcript per million reads mapped (RPKM) were calculated for genomic regions encoding the respective peptide, distinguishing highly translated regions (RPKM > 10), low-translated regions (RPKM < 10), and peptide genomic regions without ribosome footprints (RPKM = 0).

