FIG 1.

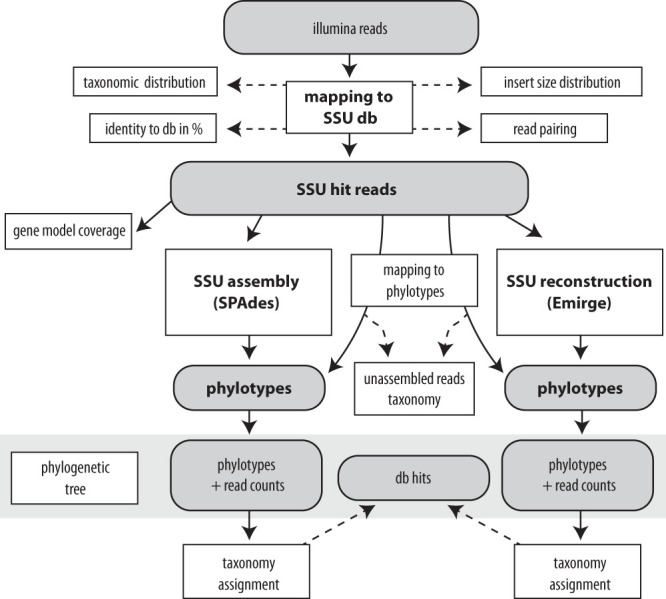
Flowchart of the phyloFlash pipeline. Gray boxes depict main data files, and white boxes with bold print show processes. Solid black arrows indicate primary workflow; dashed lines indicate processing of secondary output.

Flowchart of the phyloFlash pipeline. Gray boxes depict main data files, and white boxes with bold print show processes. Solid black arrows indicate primary workflow; dashed lines indicate processing of secondary output.