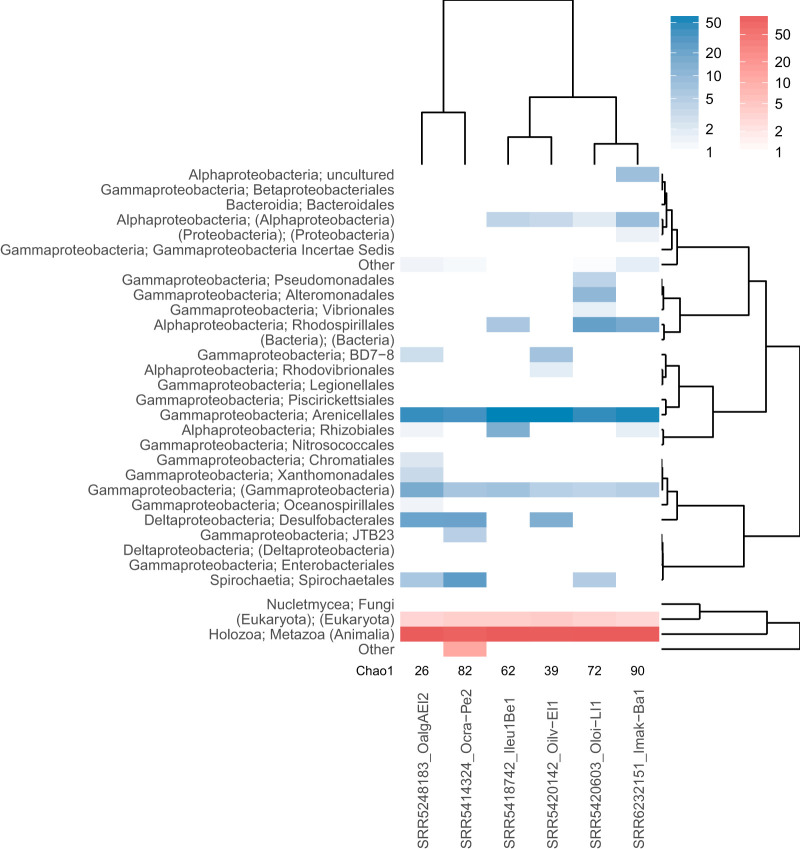
FIG 6.
Heatmap of taxonomic assignments (rows) for SSU rRNA reads in metagenome libraries of six gutless oligochaete species with symbiotic consortia (columns). The plot was generated with the comparison scripts provided with phyloFlash. Color intensities represent the percentage of reads mapping to a given taxon, separated by prokaryotes (blue) and eukaryotes (red).

