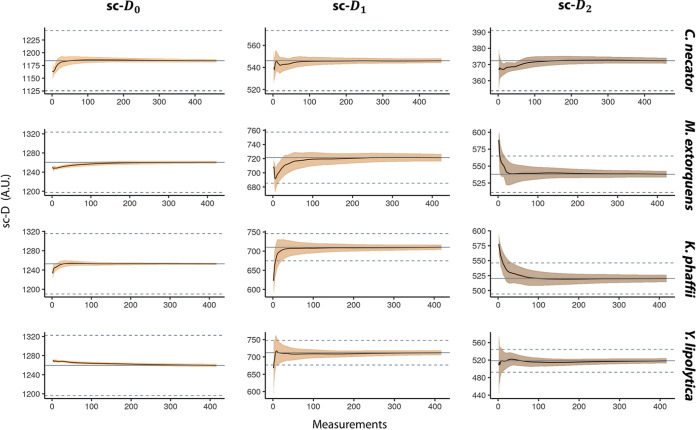
FIG 2.
Effect of sampling size on the single-cell phenotypic diversity average. We calculated the average single-cell phenotypic diversity using the Hill equations (single-cell D0, D1, and D2) for an increasing number of measurements and repeated the calculation picking spectra randomly 1,000 times. We used the Raman spectra of four pure cultures and ∼450 measurements on each. The smears represent the standard deviations. The gray lines represent the average sc-D values of the total population, and the dashed lines represent a 5% deviation from the mean.

