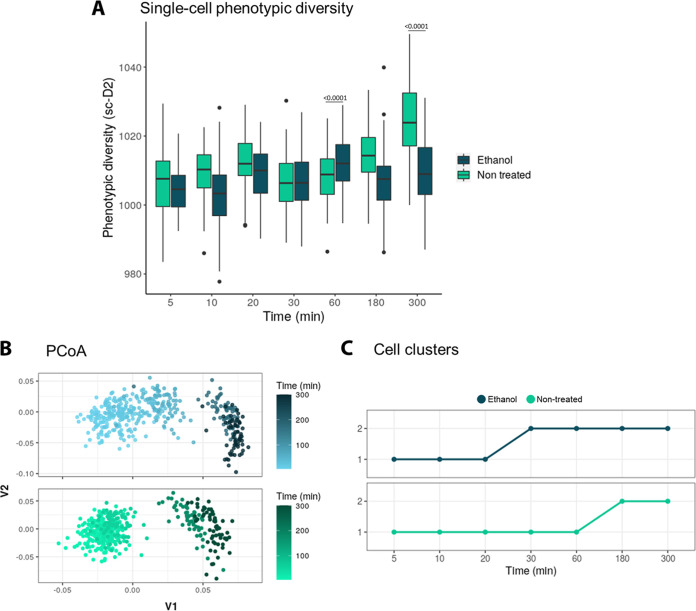
FIG 4.
(A) Single-cell phenotypic diversity (sc-D2) of the stressed (ethanol treated) and nonstressed (nontreated) E. coli populations. Treatments and treatments over time were significantly different (two-way ANOVA, P < 0.0001). A post hoc Tuckey’s test showed that the ethanol and control groups are significantly different at time points of 60 min and 180 min (P < 0.0001). (B) Raman fingerprint of the stressed (ethanol treated) and nonstressed (nontreated) E. coli populations, plotted using principal-component analysis (PCoA). The time progression is represented with a darker color. Every point represents a single cell. (C) The clustering algorithm shows the phenotypic shift happens after 20 min for the ethanol-treated population and after 180 min for the control. Two phenotypes were found. Every point represents the average “phenotypic type” of the population. N = 60.

