FIG 6.
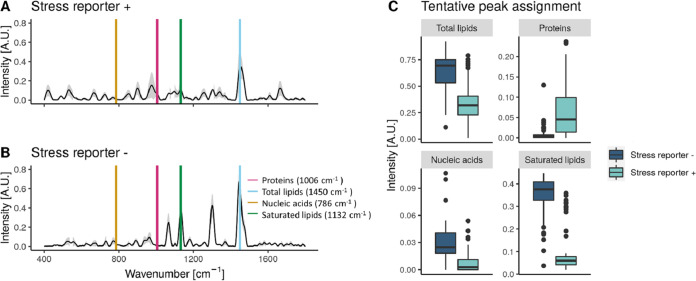
(A and B) Raman spectra of S. cerevisiae subpopulations with high (+) or low (−) expression of the stress reporter. The average of the spectra is plotted with a black line and the standard deviation in gray. The putative peaks corresponding to proteins, lipids, nucleic acids, and saturated lipids according to Teng and colleagues (14) are plotted over the spectra. (C) The intensity of the metabolic peaks highlighted in plots A and B for the subpopulations with high or low expression of the stress reporter. The peak assignment is tentative and needs to be validated by another technique. N = 65.

