FIGURE 5.
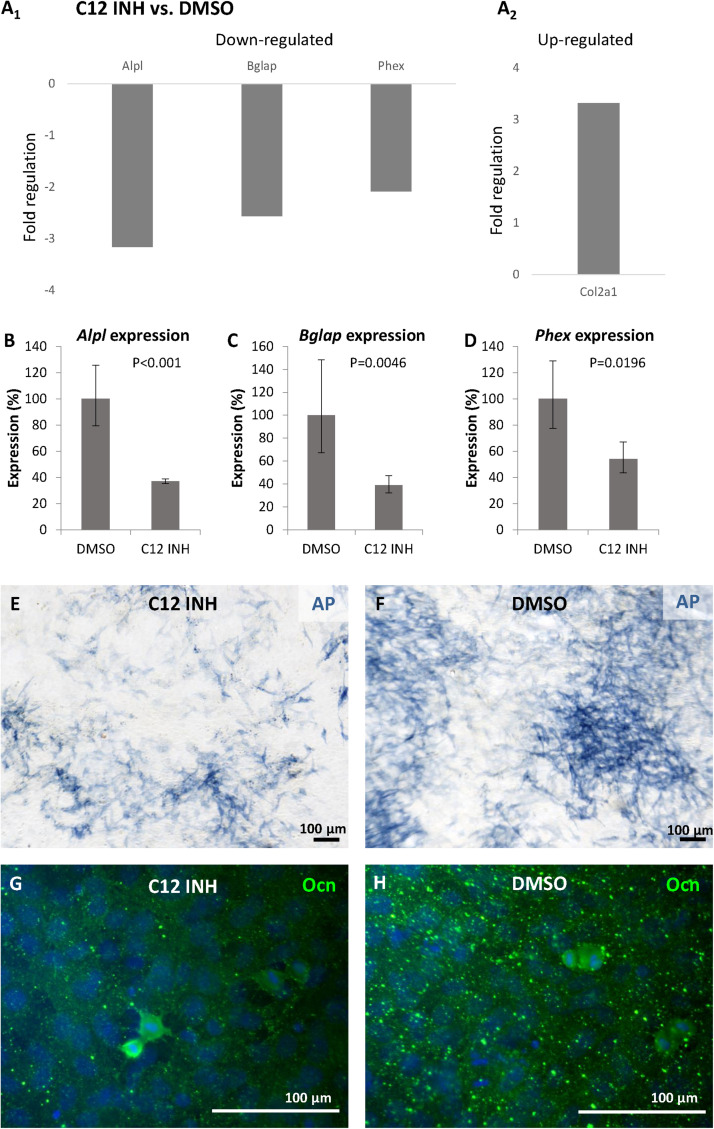
Inhibition of caspase-12 in MC3T3-E1 cells. Changes in gene expression of osteogenesis-related genes (A1,2) in differentiated MC3T3-E1 cells after inhibition of caspase-12 by the specific inhibitor Z-ATAD-FMK, and DMSO-treated cells used as a control. Analysis shows fold regulations (–2/+2 is used as the threshold) of gene expression, statistically significant (P < 0.05) changes are displayed. Real-time PCR confirmed statistically significant decrease of Alpl (B), Bglap (C), and Phex (D) in inhibited MC3T3-E1. Results are presented as means ± standard deviations and were analyzed using two-tailed t-test. Staining for activation of alkaline phosphatase (blue) in MC3T3-E1 cells after caspase-12 inhibition (E) compared to control (F). Immunofluorescence staining of osteocalcin expression (green) in differentiated MC3T3-E1 after inhibition of caspase-12 (G) compared to control (H). Scale bar: 100 μm, counterstained by DAPI (blue).

