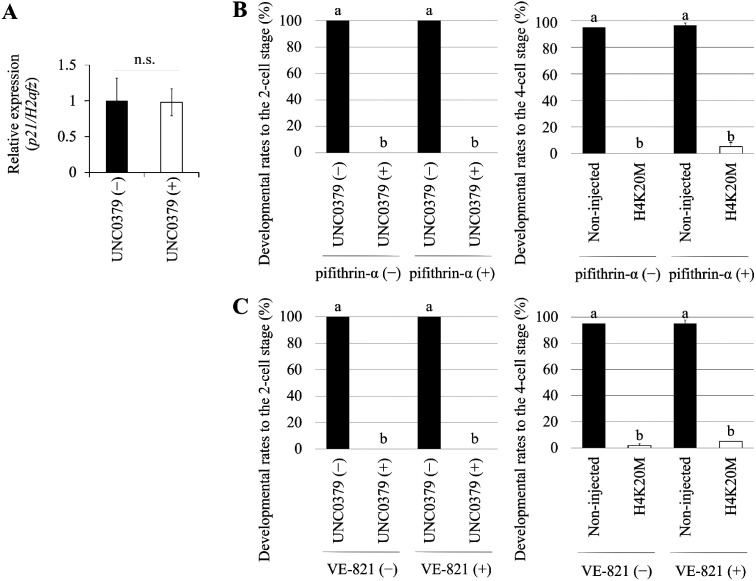
Fig. 5.
Reduction in H4K20me1 level and p53 and ATR activation. (A) qRT-PCR of p21 was performed using embryos treated or not treated with UNC0379. There was no significant difference between the expression levels in these embryos. Data were obtained from three independent experiments and were expressed as mean ± s.e.m. Statistical analysis was performed using Student’s t-test. P value < 0.05 was considered to be statistically significant. (B) Left graph shows developmental rates at 24 h post-insemination (hpi) to the two-cell stage in embryos treated with pifithrin-α and UNC0379 for 18 h (from 6 to 24 hpi). Right graph shows the developmental rates at 48 hpi to the four-cell stage of embryos overexpressing H4K20M and treated with pifithrin-α for 42 h (from 6 to 48 hpi). Non-injected embryos were used as negative control. The number of embryos analyzed were sixty. Data were from three independent experiments and were expressed as mean ± s.e.m. Statistical analysis was performed using one-way analysis of variance (ANOVA) followed by Tukey-Kramer test. P value < 0.05 was considered to be statistically significant, represented by different letters (a and b). (C) Left graph shows the developmental rates at 24 hpi to the two-cell stage of embryos treated with VE-821 and UNC0379 for 18 h (from 6 to 24 hpi). Right graph shows the developmental rates at 48 hpi to the four-cell stage of embryos overexpressing H4K20M and treated with VE-821 for 42 h (from 6 to 48 hpi). Non-injected embryos were used as negative control. The number of embryos analyzed were sixty. Data were from three independent experiments and were expressed as mean ± s.e.m. Statistical analysis was performed using one-way analysis of variance (ANOVA) followed by Tukey-Kramer test. P value < 0.05 was considered to be statistically significant, represented by different letters (a and b).

