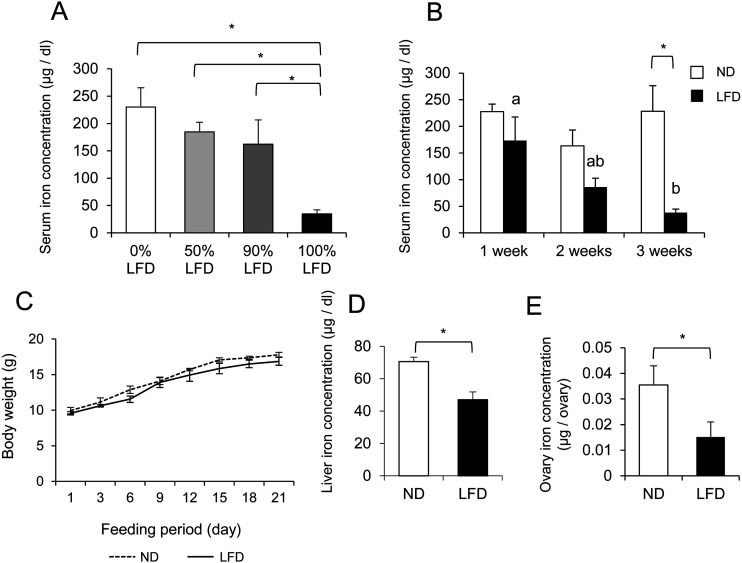
Fig. 2.
Effect of the feeding of the low-Fe diet (LFD) to mice on the iron concentration in serum, liver and ovary at diestrus phase. A) 0% LFD; 3-week-old mice were fed with the normal diet (ND) for 3 weeks. 50% LFD; 3-week-old mice were fed with the mixed chow of 50% ND and 50% LFD for 3 weeks. 90% LFD; 3-week-old mice were fed with the mixed chow of 10% ND and 90% LFD for 3 weeks.100% LFD; 3-week-old mice were fed with the LFD for 3 weeks. B) LFD 1 week; 3-week-old mice were fed with the LFD for 1 week. LFD 2 weeks; 3-week-old mice were fed with the LFD for 2 weeks. LFD 3 weeks; 3-week-old mice were fed with the LFD for 3 weeks. C) 3-week-old mice were fed with the ND or 100% LFD for 3 weeks. The body weights were measured every morning. D) 3-week-old mice were fed with the ND or 100% LFD for 3 weeks. After feeding periods, the iron concentration in the liver was measured. E) 3-week-old mice were fed with the ND or 100% LFD for 3 weeks. After feeding periods, the iron concentration in the ovary was measured. Values are mean ± SEM of 3 independent experiments (n = 3). * The significant differences were observed in between the ND and LFD mice (P < 0.05). a, b The significant differences were observed in the serum iron concentrations obtained from the mice fed for between 1 week and 3 weeks (P < 0.05).

