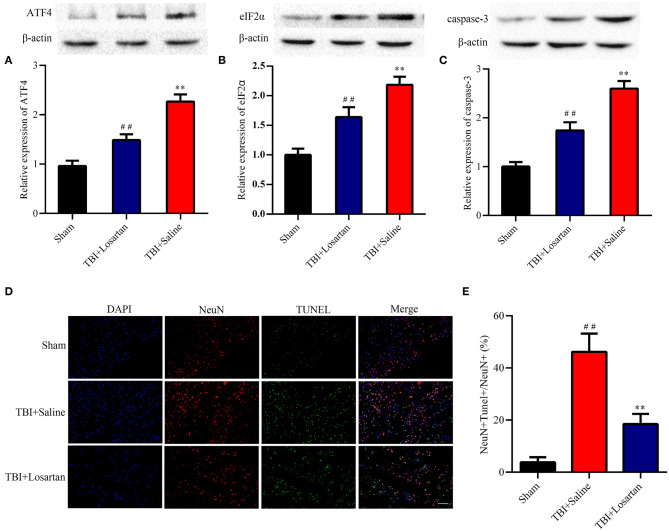
Figure 5.
Effects of losartan on the expression level of ER stress-associated proteins, and apoptosis protein at 72 h after TBI. Representative results of ATF4 (A), eIF2α (B), and caspase-3 (C) alteration in the different groups. All the results are expressed as the mean ± SD, and n = 4 for each group. **p < 0.01 vs. sham; ##p < 0.01 vs. TBI+saline. (D) Representative fluorescence of apoptotic neurons in the cortex of peri-lesion at 3 days after TBI. Fluorescence colors: NeuN: red, terminal deoxynucleotidyl transferase-dUTP nick end labeling (TUNEL): green, and DAPI: blue. Scale bar = 400 μm. NeuN and TUNEL double stained cells represented the apoptotic neuron. (E) Quantification of apoptotic neurons between the different groups. ** < 0.01, vs. TBI + Saline group, ## < 0.01, vs. Sham group.

