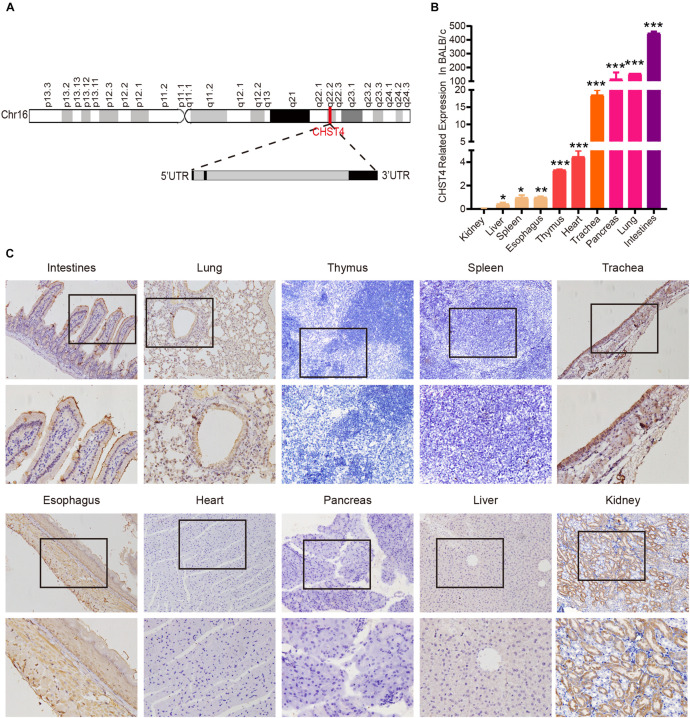
FIGURE 1.
Structure of the carbohydrate sulfotransferase 4 (CHST4) gene and its distribution in BALB/c mice tissues. (A) Chromosome location (red line; top) and gene structure of CHST4 (bottom; black boxes represent exons and gray boxes represent introns). (B) Relative expression of CHST4 mRNA in various tissues of BALB/c mice by quantitative real-time (qRT)-PCR. GAPDH was used as the loading control. Bars represent the mean ± SD (n = 4); *P < 0.05, **P < 0.01, ***P < 0.001 (Student’s t-test). All samples were tested in triplicate. (C) Immunohistochemical analysis of the expression and distribution of CHST4 protein in BALB/c mice tissues (100×; 400×; four samples in each group).

