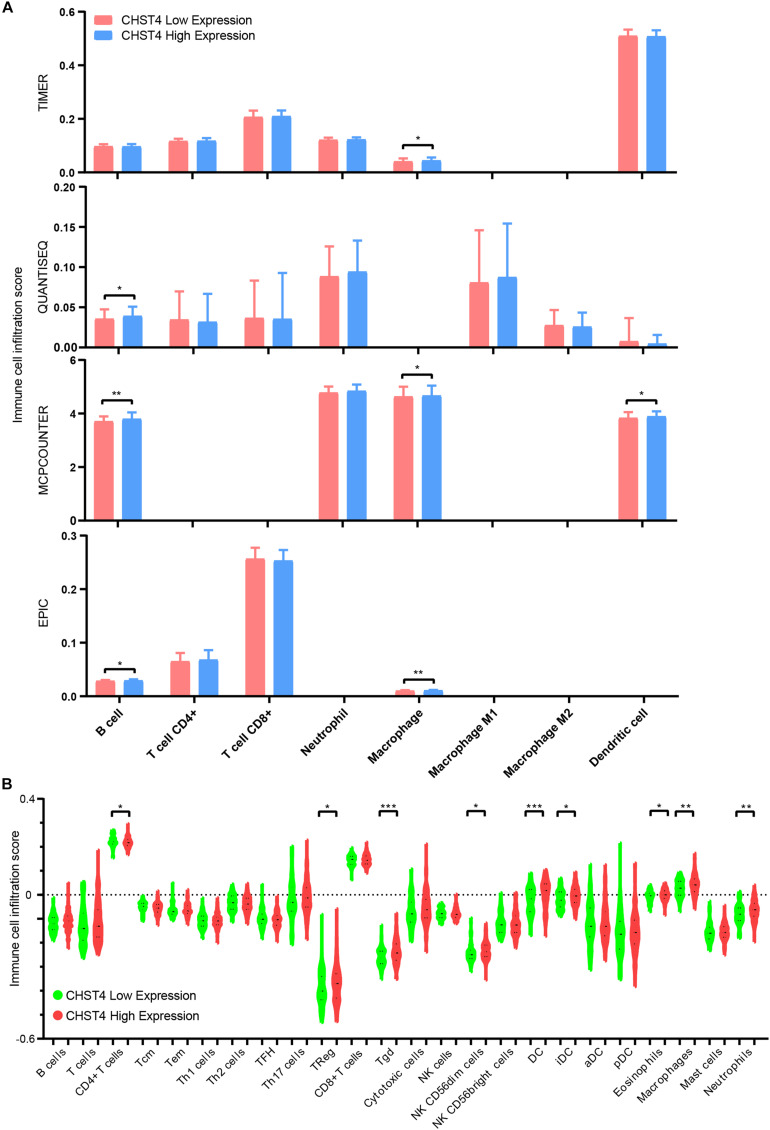
FIGURE 8.
The correlation between CHST4 and immune cell infiltration in HBV-HCC. (A) The degree of immune infiltration in HBV-HCC was evaluated by TIMER platform (TIMER, QUANTISEQ, MCPCOUNTER, and EPIC databases). Bar represents the mean ± SD; *P < 0.05, **P < 0.01 (Student’s t-test). (B) The immune cell infiltration score in HBV-HCC using R-ssGSEA (Tcm, T central memory cells; Tem, T effector memory cells; Th1 cells, T helper 1 cells; Th2 cells, T helper 2 cells; TFH, T follicular helper cells; Th17 cells, T helper 17 cells; Treg, regulatory T cells; Tgd, T gamma delta cells; NK cells, natural killer cells; DC, dendritic cell; iDC, immature DC; aDC, activated DC; pDC, plasmacytoid DC). Bars represent the mean ± SD; *P < 0.05, **P < 0.01, ***P < 0.001 (Student’s t-test).

