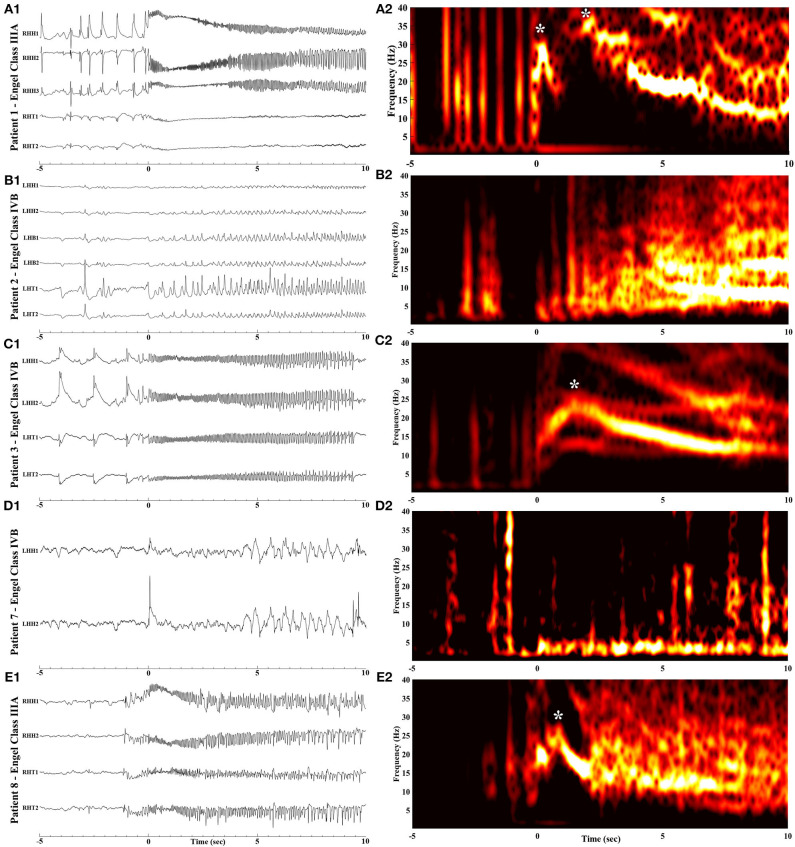
Figure 3.
Raw iEEG (left, A1-E1) from the MT contacts and respective time-frequency analysis (right, A2-E2) of seizure onsets in patients with poor outcome. (A1,A2) Patient 1 with Engel Class IIIA outcome. (B1,B2) Patient 2 with Engel Class IVB outcome. (C1,C2) Patient 3 with Engel Class IVB outcome. (D1,D2) Patient 7 with Engel Class IVB outcome. (E1,E2) Patient 8 with Engel Class IIIA outcome. Notice the rise in frequency content with a peak indicated by asterisks, following ictal onset (at time = 0).

