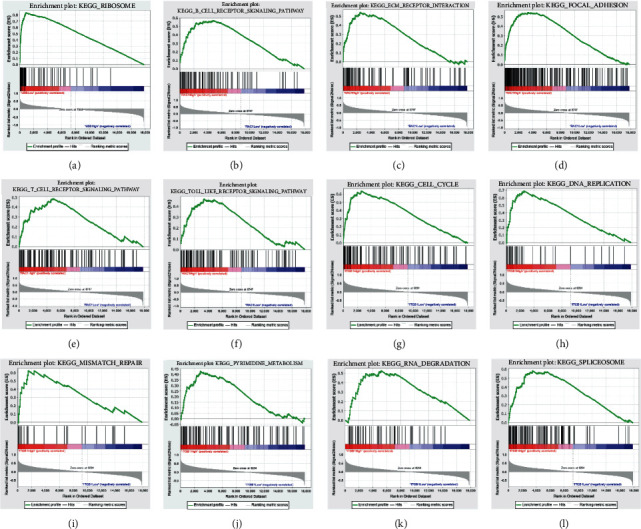
Figure 7.

Enrichment plots by GSEA. Relative pathways associated with the expression of (a) UBB, (b–f) RACI, and (g–l) ITGB1 are displayed. GSEA: Gene Set Enrichment Analysis; KEGG: Kyoto Encyclopedia of Genes and Genomes pathway.

Enrichment plots by GSEA. Relative pathways associated with the expression of (a) UBB, (b–f) RACI, and (g–l) ITGB1 are displayed. GSEA: Gene Set Enrichment Analysis; KEGG: Kyoto Encyclopedia of Genes and Genomes pathway.