
Figure 7.
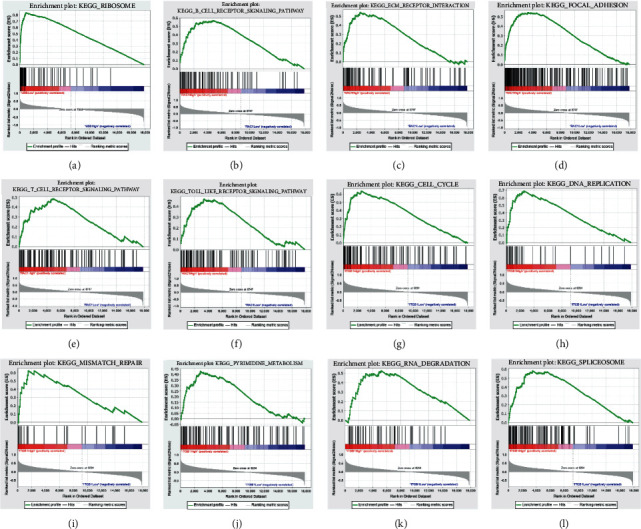
Enrichment plots by GSEA. Relative pathways associated with the expression of (a) UBB, (b–f) RACI, and (g–l) ITGB1 are displayed. GSEA: Gene Set Enrichment Analysis; KEGG: Kyoto Encyclopedia of Genes and Genomes pathway.
Official websites use .gov
A
.gov website belongs to an official
government organization in the United States.
Secure .gov websites use HTTPS
A lock (
) or https:// means you've safely
connected to the .gov website. Share sensitive
information only on official, secure websites.
Enrichment plots by GSEA. Relative pathways associated with the expression of (a) UBB, (b–f) RACI, and (g–l) ITGB1 are displayed. GSEA: Gene Set Enrichment Analysis; KEGG: Kyoto Encyclopedia of Genes and Genomes pathway.