Figure 2.
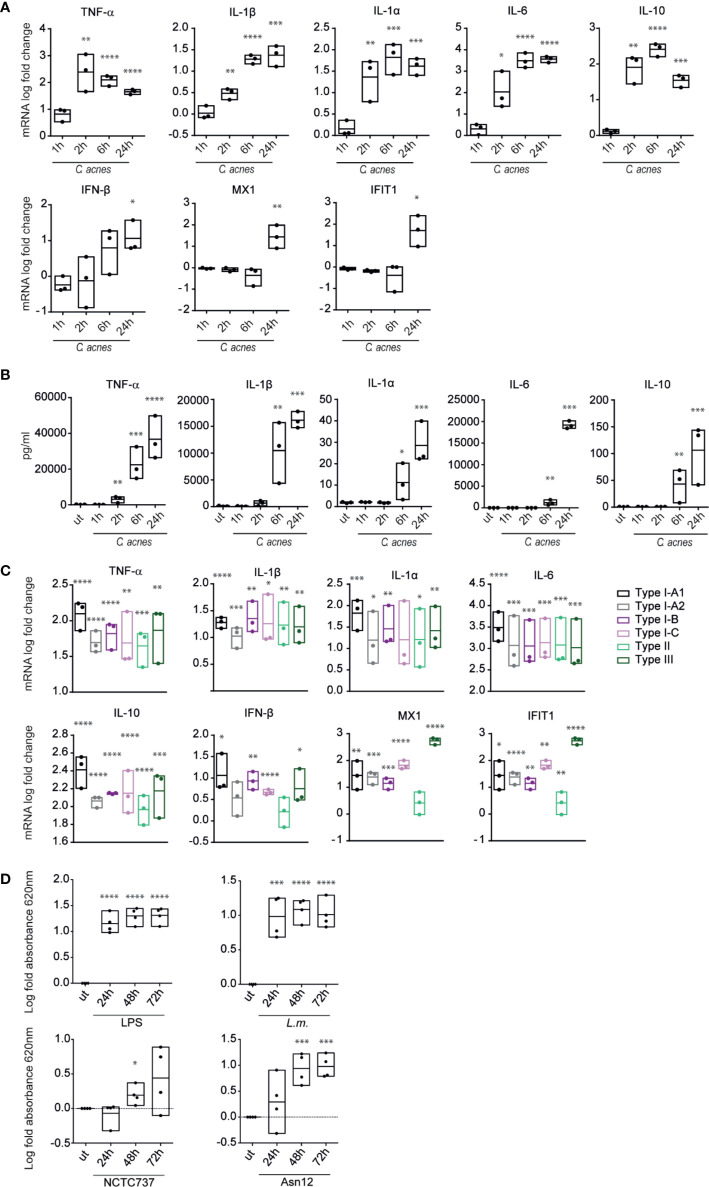
Cytokine expression and secretion in response to C. acnes. (A) Differentiated THP-1 cells were infected with C. acnes strain NCTC737 for indicated timepoints. HPRT-normalized gene expression was measured using RT-qPCR and shown as log transformed fold-change to the uninfected sample. (B) Cytokine levels in the supernatant of (A) were measured using the Luminex assay. (C) Differentiated THP-1 cells were infected with one strain of each C. acnes phylotype: NCTC737 (phylotype IA1), P. acn31 (phylotype IA2), KPA171202 (phylotype IB), PV66 (phylotype IC), ATCC11828 (phylotype II) and Asn12 (phylotype III). HPRT-normalized gene expression was measured using RT-qPCR and shown as log transformed fold change to the uninfected sample. TNF-α, IL-1β, IL-1α, IL6, and IL-10 mRNA expression was measured after 6 h post infection (pi). IFN-β, MX1, and IFIT1 mRNA expression was measured 24 h pi. (D) THP1-BlueTM ISG cells (see text) were infected with L.m., C. acnes strain NCTC737 and Asn12 or stimulated with 0.4 µg/ml LPS. After 24, 48, and 72 h, supernatant was analyzed by measuring the absorbance at 620 nm with QUANTI-Blue™ solution. (A–D) Data represent the mean values of three independent experiments. P. values were calculated using the unpaired t-test of log transformed values compared to the uninfected sample (*P ≤ 0.05; **P ≤ 0.01; ***P ≤ 0.001; ****P ≤ 0.0001).

