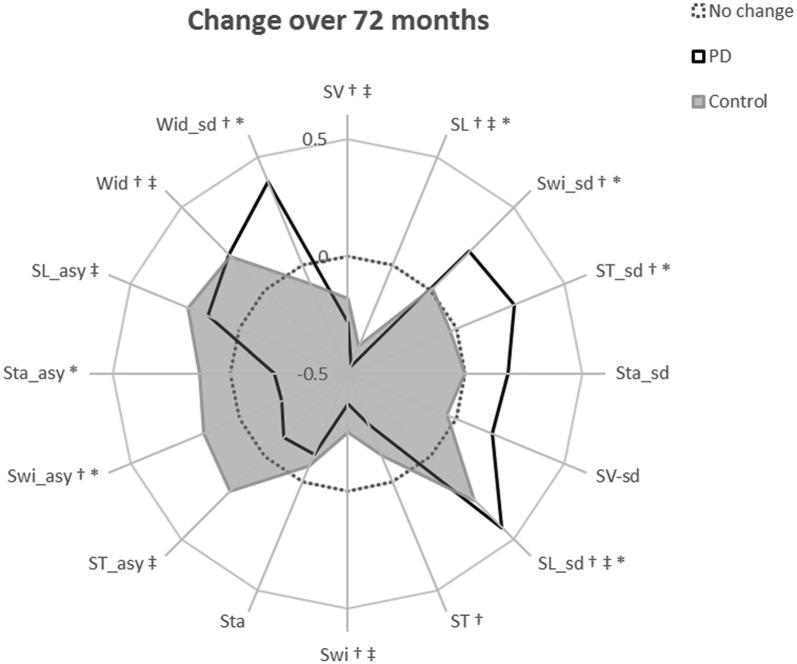
Figure 3.
Radar plot illustrating the relative change in each gait characteristic over 72-months. The central dotted line represents no change. Deviations from zero along the axes radiating from the center of the plot represent the relative change in each gait characteristic over 72-months within each diagnostic group, calculated as the modeled change per year divided by the standard deviation of the modeled change. Gait characteristics are abbreviated as follows: SV, step velocity; SL, step length; Swi, swing time; ST, Step time; Sta, Stance time; Wid, Step width; sd, standard deviation (gait variability); asy, asymmetry. †indicates a significant change in gait in the PD cohort over 72 months; ‡indicates a significant change in gait in controls over 72 months; *indicates a significantly different rate of change in PD gait compared to the rate of gait change in controls. †*Denotes criteria 1 satisfied; †‡denotes criteria 2 satisfied; †‡*denotes criteria 3 satisfied.

